Sioux vs Immigrants from Saudi Arabia Child Poverty Among Boys Under 16

COMPARE

Sioux
Race
Ancestry
AfghanAfricanAlaska NativeAlaskan AthabascanAlbanianAleutAlsatianAmericanApacheArabArapahoArgentineanArmenianAssyrian/Chaldean/SyriacAustralianAustrianBahamianBangladeshiBarbadianBasqueBelgianBelizeanBermudanBhutaneseBlackfeetBolivianBrazilianBritishBritish West IndianBulgarianBurmeseCajunCambodianCanadianCape VerdeanCarpatho RusynCelticCentral AmericanCentral American IndianCherokeeCheyenneChickasawChileanChineseChippewaChoctawColombianColvilleComancheCosta RicanCreeCreekCroatianCrowCubanCypriotCzechCzechoslovakianDanishDelawareDominicanDutchDutch West IndianEastern EuropeanEcuadorianEgyptianEnglishEstonianEthiopianEuropeanFijianFilipinoFinnishFrenchFrench American IndianFrench CanadianGermanGerman RussianGhanaianGreekGuamanian/ChamorroGuatemalanGuyaneseHaitianHmongHonduranHopiHoumaHungarianIcelanderIndian (Asian)IndonesianInupiatIranianIraqiIrishIroquoisIsraeliItalianJamaicanJapaneseJordanianKenyanKiowaKoreanLaotianLatvianLebaneseLiberianLithuanianLumbeeLuxembourgerMacedonianMalaysianMalteseMarshalleseMenomineeMexicanMexican American IndianMongolianMoroccanNative HawaiianNavajoNepaleseNew ZealanderNicaraguanNigerianNorthern EuropeanNorwegianOkinawanOsageOttawaPaiutePakistaniPalestinianPanamanianParaguayanPennsylvania GermanPeruvianPimaPolishPortuguesePotawatomiPuebloPuerto RicanPuget Sound SalishRomanianRussianSalvadoranSamoanScandinavianScotch-IrishScottishSeminoleSenegaleseSerbianShoshoneSierra LeoneanSiouxSlavicSlovakSloveneSomaliSouth AfricanSouth AmericanSouth American IndianSoviet UnionSpaniardSpanishSpanish AmericanSpanish American IndianSri LankanSubsaharan AfricanSudaneseSwedishSwissSyrianTaiwaneseThaiTlingit-HaidaTohono O'OdhamTonganTrinidadian and TobagonianTsimshianTurkishU.S. Virgin IslanderUgandanUkrainianUruguayanUteVenezuelanVietnameseWelshWest IndianYakamaYaquiYugoslavianYumanYup'ikZimbabwean
Immigration
NonimmigrantsImmigrantsAfghanistanAfricaAlbaniaArgentinaArmeniaAsiaAustraliaAustriaBahamasBangladeshBarbadosBelarusBelgiumBelizeBoliviaBosnia and HerzegovinaBrazilBulgariaBurma/MyanmarCabo VerdeCambodiaCameroonCanadaCaribbeanCentral AmericaChileChinaColombiaCongoCosta RicaCroatiaCubaCzechoslovakiaDenmarkDominicaDominican RepublicEastern AfricaEastern AsiaEastern EuropeEcuadorEgyptEl SalvadorEnglandEritreaEthiopiaEuropeFijiFranceGermanyGhanaGreeceGrenadaGuatemalaGuyanaHaitiHondurasHong KongHungaryIndiaIndonesiaIranIraqIrelandIsraelItalyJamaicaJapanJordanKazakhstanKenyaKoreaKuwaitLaosLatin AmericaLatviaLebanonLiberiaLithuaniaMalaysiaMexicoMicronesiaMiddle AfricaMoldovaMoroccoNepalNetherlandsNicaraguaNigeriaNorth AmericaNorth MacedoniaNorthern AfricaNorthern EuropeNorwayOceaniaPakistanPanamaPeruPhilippinesPolandPortugalRomaniaRussiaScotlandSenegalSerbiaSierra LeoneSingaporeSomaliaSouth AfricaSouth AmericaSouth Central AsiaSouth Eastern AsiaSouthern EuropeSpainSri LankaSt. Vincent and the GrenadinesSudanSwedenSwitzerlandSyriaTaiwanThailandTrinidad and TobagoTurkeyUgandaUkraineUruguayUzbekistanVenezuelaVietnamWest IndiesWestern AfricaWestern AsiaWestern EuropeYemenZaireZimbabweAzores
Immigrants from Saudi Arabia
Race
Ancestry
AfghanAfricanAlaska NativeAlaskan AthabascanAlbanianAleutAlsatianAmericanApacheArabArapahoArgentineanArmenianAssyrian/Chaldean/SyriacAustralianAustrianBahamianBangladeshiBarbadianBasqueBelgianBelizeanBermudanBhutaneseBlackfeetBolivianBrazilianBritishBritish West IndianBulgarianBurmeseCajunCambodianCanadianCape VerdeanCarpatho RusynCelticCentral AmericanCentral American IndianCherokeeCheyenneChickasawChileanChineseChippewaChoctawColombianColvilleComancheCosta RicanCreeCreekCroatianCrowCubanCypriotCzechCzechoslovakianDanishDelawareDominicanDutchDutch West IndianEastern EuropeanEcuadorianEgyptianEnglishEstonianEthiopianEuropeanFijianFilipinoFinnishFrenchFrench American IndianFrench CanadianGermanGerman RussianGhanaianGreekGuamanian/ChamorroGuatemalanGuyaneseHaitianHmongHonduranHopiHoumaHungarianIcelanderIndian (Asian)IndonesianInupiatIranianIraqiIrishIroquoisIsraeliItalianJamaicanJapaneseJordanianKenyanKiowaKoreanLaotianLatvianLebaneseLiberianLithuanianLumbeeLuxembourgerMacedonianMalaysianMalteseMarshalleseMenomineeMexicanMexican American IndianMongolianMoroccanNative HawaiianNavajoNepaleseNew ZealanderNicaraguanNigerianNorthern EuropeanNorwegianOkinawanOsageOttawaPaiutePakistaniPalestinianPanamanianParaguayanPennsylvania GermanPeruvianPimaPolishPortuguesePotawatomiPuebloPuerto RicanPuget Sound SalishRomanianRussianSalvadoranSamoanScandinavianScotch-IrishScottishSeminoleSenegaleseSerbianShoshoneSierra LeoneanSlavicSlovakSloveneSomaliSouth AfricanSouth AmericanSouth American IndianSoviet UnionSpaniardSpanishSpanish AmericanSpanish American IndianSri LankanSubsaharan AfricanSudaneseSwedishSwissSyrianTaiwaneseThaiTlingit-HaidaTohono O'OdhamTonganTrinidadian and TobagonianTsimshianTurkishU.S. Virgin IslanderUgandanUkrainianUruguayanUteVenezuelanVietnameseWelshWest IndianYakamaYaquiYugoslavianYumanYup'ikZimbabwean
Immigration
NonimmigrantsImmigrantsAfghanistanAfricaAlbaniaArgentinaArmeniaAsiaAustraliaAustriaBahamasBangladeshBarbadosBelarusBelgiumBelizeBoliviaBosnia and HerzegovinaBrazilBulgariaBurma/MyanmarCabo VerdeCambodiaCameroonCanadaCaribbeanCentral AmericaChileChinaColombiaCongoCosta RicaCroatiaCubaCzechoslovakiaDenmarkDominicaDominican RepublicEastern AfricaEastern AsiaEastern EuropeEcuadorEgyptEl SalvadorEnglandEritreaEthiopiaEuropeFijiFranceGermanyGhanaGreeceGrenadaGuatemalaGuyanaHaitiHondurasHong KongHungaryIndiaIndonesiaIranIraqIrelandIsraelItalyJamaicaJapanJordanKazakhstanKenyaKoreaKuwaitLaosLatin AmericaLatviaLebanonLiberiaLithuaniaMalaysiaMexicoMicronesiaMiddle AfricaMoldovaMoroccoNepalNetherlandsNicaraguaNigeriaNorth AmericaNorth MacedoniaNorthern AfricaNorthern EuropeNorwayOceaniaPakistanPanamaPeruPhilippinesPolandPortugalRomaniaRussiaSaudi ArabiaScotlandSenegalSerbiaSierra LeoneSingaporeSomaliaSouth AfricaSouth AmericaSouth Central AsiaSouth Eastern AsiaSouthern EuropeSpainSri LankaSt. Vincent and the GrenadinesSudanSwedenSwitzerlandSyriaTaiwanThailandTrinidad and TobagoTurkeyUgandaUkraineUruguayUzbekistanVenezuelaVietnamWest IndiesWestern AfricaWestern AsiaWestern EuropeYemenZaireZimbabweAzores
Child Poverty Among Boys Under 16
Income
Poverty
Unemployment
Labor Participation
Family Structure
Vehicle Availability
Education Level
Disability

Child Poverty Among Boys Under 16 Comparison

Sioux

Immigrants from Saudi Arabia

Tragic
Average
25.3%
CHILD POVERTY AMONG BOYS UNDER 16
0.0/ 100
METRIC RATING
336th/ 347
METRIC RANK
16.4%
CHILD POVERTY AMONG BOYS UNDER 16
53.6/ 100
METRIC RATING
169th/ 347
METRIC RANK

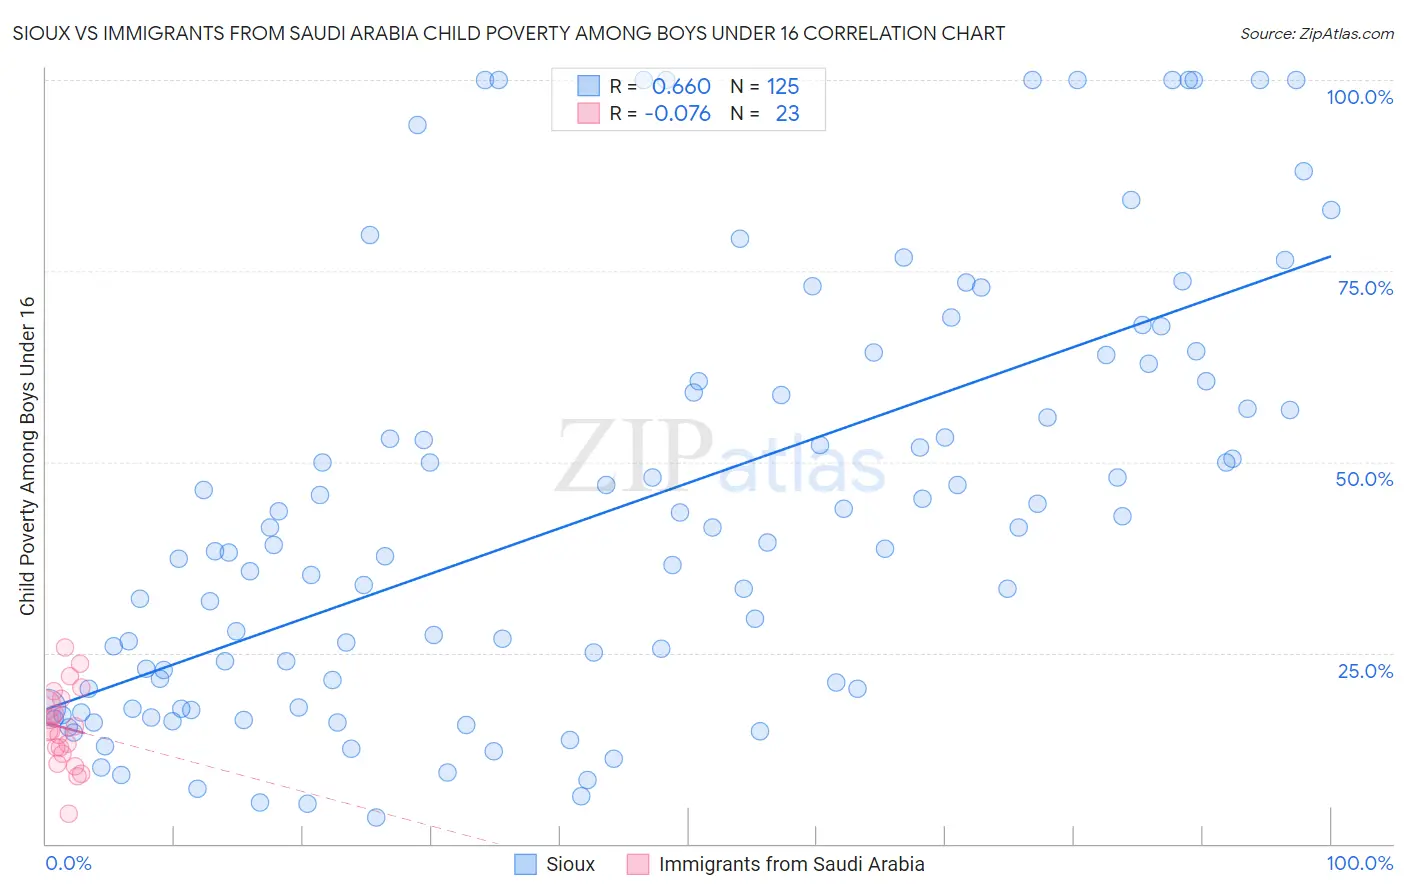
Sioux vs Immigrants from Saudi Arabia Child Poverty Among Boys Under 16 Correlation Chart

The statistical analysis conducted on geographies consisting of 232,204,453 people shows a significant positive correlation between the proportion of Sioux and poverty level among boys under the age of 16 in the United States with a correlation coefficient (R) of 0.660 and weighted average of 25.3%. Similarly, the statistical analysis conducted on geographies consisting of 163,294,532 people shows a slight negative correlation between the proportion of Immigrants from Saudi Arabia and poverty level among boys under the age of 16 in the United States with a correlation coefficient (R) of -0.076 and weighted average of 16.4%, a difference of 54.6%.
Sioux vs Immigrants from Saudi Arabia Child Poverty Among Boys Under 16

Child Poverty Among Boys Under 16 Correlation Summary

MeasurementSiouxImmigrants from Saudi Arabia
Minimum3.4%3.9%
Maximum100.0%25.7%
Range96.6%21.8%
Mean43.5%15.2%
Median39.1%14.8%
Interquartile 25% (IQ1)19.1%11.8%
Interquartile 75% (IQ3)60.5%18.9%
Interquartile Range (IQR)41.5%7.1%
Standard Deviation (Sample)27.5%5.2%
Standard Deviation (Population)27.4%5.1%

Similar Demographics by Child Poverty Among Boys Under 16

Demographics Similar to Sioux by Child Poverty Among Boys Under 16

In terms of child poverty among boys under 16, the demographic groups most similar to Sioux are Cheyenne (25.8%, a difference of 2.0%), Yup'ik (24.7%, a difference of 2.3%), Hopi (25.9%, a difference of 2.5%), Black/African American (24.5%, a difference of 3.2%), and Apache (24.5%, a difference of 3.3%).
DemographicsRating | RankChild Poverty Among Boys Under 16
Natives/Alaskans
0.0
/100
|
#329
Tragic
24.0%
Colville
0.0
/100
|
#330
Tragic
24.1%
Dominicans
0.0
/100
|
#331
Tragic
24.2%
Immigrants | Dominican Republic
0.0
/100
|
#332
Tragic
24.3%
Apache
0.0
/100
|
#333
Tragic
24.5%
Blacks/African Americans
0.0
/100
|
#334
Tragic
24.5%
Yup'ik
0.0
/100
|
#335
Tragic
24.7%
Sioux
0.0
/100
|
#336
Tragic
25.3%
Cheyenne
0.0
/100
|
#337
Tragic
25.8%
Hopi
0.0
/100
|
#338
Tragic
25.9%
Houma
0.0
/100
|
#339
Tragic
26.2%
Crow
0.0
/100
|
#340
Tragic
26.3%
Immigrants | Yemen
0.0
/100
|
#341
Tragic
28.9%
Pima
0.0
/100
|
#342
Tragic
29.7%
Navajo
0.0
/100
|
#343
Tragic
30.3%

Demographics Similar to Immigrants from Saudi Arabia by Child Poverty Among Boys Under 16

In terms of child poverty among boys under 16, the demographic groups most similar to Immigrants from Saudi Arabia are South American (16.3%, a difference of 0.19%), Afghan (16.3%, a difference of 0.20%), Immigrants from Bosnia and Herzegovina (16.4%, a difference of 0.21%), Immigrants from Ethiopia (16.4%, a difference of 0.27%), and Immigrants from Colombia (16.4%, a difference of 0.32%).
DemographicsRating | RankChild Poverty Among Boys Under 16
Guamanians/Chamorros
69.6
/100
|
#162
Good
16.1%
Costa Ricans
68.1
/100
|
#163
Good
16.1%
Immigrants | Albania
67.9
/100
|
#164
Good
16.1%
Colombians
65.2
/100
|
#165
Good
16.1%
Immigrants | Germany
63.6
/100
|
#166
Good
16.2%
Afghans
55.4
/100
|
#167
Average
16.3%
South Americans
55.3
/100
|
#168
Average
16.3%
Immigrants | Saudi Arabia
53.6
/100
|
#169
Average
16.4%
Immigrants | Bosnia and Herzegovina
51.7
/100
|
#170
Average
16.4%
Immigrants | Ethiopia
51.3
/100
|
#171
Average
16.4%
Immigrants | Colombia
50.8
/100
|
#172
Average
16.4%
Tsimshian
50.5
/100
|
#173
Average
16.4%
Uruguayans
50.0
/100
|
#174
Average
16.4%
Immigrants | Syria
49.0
/100
|
#175
Average
16.5%
Whites/Caucasians
48.2
/100
|
#176
Average
16.5%