Sioux vs Immigrants from Saudi Arabia Bachelor's Degree
COMPARE
Sioux
Immigrants from Saudi Arabia
Bachelor's Degree
Bachelor's Degree Comparison
Sioux
Immigrants from Saudi Arabia
29.1%
BACHELOR'S DEGREE
0.0/ 100
METRIC RATING
316th/ 347
METRIC RANK
44.8%
BACHELOR'S DEGREE
100.0/ 100
METRIC RATING
42nd/ 347
METRIC RANK
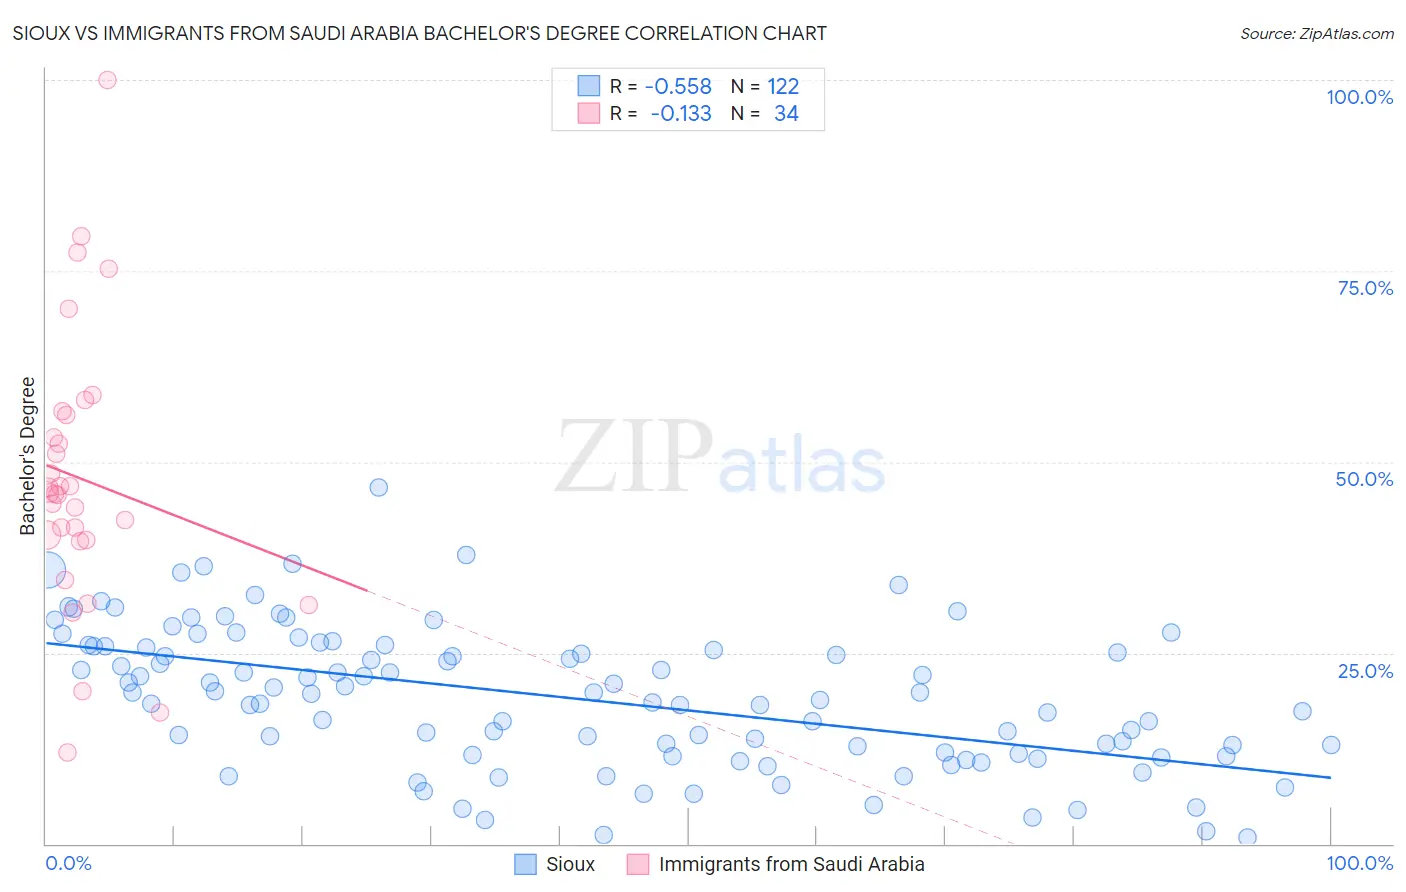
Sioux vs Immigrants from Saudi Arabia Bachelor's Degree Correlation Chart
The statistical analysis conducted on geographies consisting of 234,183,414 people shows a substantial negative correlation between the proportion of Sioux and percentage of population with at least bachelor's degree education in the United States with a correlation coefficient (R) of -0.558 and weighted average of 29.1%. Similarly, the statistical analysis conducted on geographies consisting of 164,289,450 people shows a poor negative correlation between the proportion of Immigrants from Saudi Arabia and percentage of population with at least bachelor's degree education in the United States with a correlation coefficient (R) of -0.133 and weighted average of 44.8%, a difference of 54.3%.
Bachelor's Degree Correlation Summary
| Measurement | Sioux | Immigrants from Saudi Arabia |
| Minimum | 0.75% | 11.9% |
| Maximum | 46.6% | 100.0% |
| Range | 45.8% | 88.1% |
| Mean | 19.1% | 47.8% |
| Median | 19.7% | 45.9% |
| Interquartile 25% (IQ1) | 11.8% | 39.7% |
| Interquartile 75% (IQ3) | 25.8% | 56.1% |
| Interquartile Range (IQR) | 14.0% | 16.4% |
| Standard Deviation (Sample) | 9.2% | 18.0% |
| Standard Deviation (Population) | 9.1% | 17.7% |
Similar Demographics by Bachelor's Degree
Demographics Similar to Sioux by Bachelor's Degree
In terms of bachelor's degree, the demographic groups most similar to Sioux are Colville (29.0%, a difference of 0.20%), Yaqui (29.0%, a difference of 0.25%), Immigrants from Cabo Verde (29.2%, a difference of 0.62%), Shoshone (29.3%, a difference of 0.71%), and Creek (28.9%, a difference of 0.71%).
| Demographics | Rating | Rank | Bachelor's Degree |
| Hispanics or Latinos | 0.0 /100 | #309 | Tragic 29.6% |
| Cheyenne | 0.0 /100 | #310 | Tragic 29.4% |
| Choctaw | 0.0 /100 | #311 | Tragic 29.4% |
| Seminole | 0.0 /100 | #312 | Tragic 29.4% |
| Alaska Natives | 0.0 /100 | #313 | Tragic 29.4% |
| Shoshone | 0.0 /100 | #314 | Tragic 29.3% |
| Immigrants | Cabo Verde | 0.0 /100 | #315 | Tragic 29.2% |
| Sioux | 0.0 /100 | #316 | Tragic 29.1% |
| Colville | 0.0 /100 | #317 | Tragic 29.0% |
| Yaqui | 0.0 /100 | #318 | Tragic 29.0% |
| Creek | 0.0 /100 | #319 | Tragic 28.9% |
| Kiowa | 0.0 /100 | #320 | Tragic 28.8% |
| Alaskan Athabascans | 0.0 /100 | #321 | Tragic 28.8% |
| Tsimshian | 0.0 /100 | #322 | Tragic 28.8% |
| Fijians | 0.0 /100 | #323 | Tragic 28.7% |
Demographics Similar to Immigrants from Saudi Arabia by Bachelor's Degree
In terms of bachelor's degree, the demographic groups most similar to Immigrants from Saudi Arabia are Immigrants from South Africa (44.8%, a difference of 0.14%), Immigrants from Malaysia (45.0%, a difference of 0.38%), Immigrants from Belarus (45.0%, a difference of 0.42%), Immigrants from Lithuania (44.6%, a difference of 0.49%), and Immigrants from Kuwait (44.6%, a difference of 0.52%).
| Demographics | Rating | Rank | Bachelor's Degree |
| Immigrants | Russia | 100.0 /100 | #35 | Exceptional 45.4% |
| Mongolians | 100.0 /100 | #36 | Exceptional 45.4% |
| Russians | 100.0 /100 | #37 | Exceptional 45.3% |
| Bulgarians | 100.0 /100 | #38 | Exceptional 45.3% |
| Immigrants | Latvia | 100.0 /100 | #39 | Exceptional 45.1% |
| Immigrants | Belarus | 100.0 /100 | #40 | Exceptional 45.0% |
| Immigrants | Malaysia | 100.0 /100 | #41 | Exceptional 45.0% |
| Immigrants | Saudi Arabia | 100.0 /100 | #42 | Exceptional 44.8% |
| Immigrants | South Africa | 99.9 /100 | #43 | Exceptional 44.8% |
| Immigrants | Lithuania | 99.9 /100 | #44 | Exceptional 44.6% |
| Immigrants | Kuwait | 99.9 /100 | #45 | Exceptional 44.6% |
| Immigrants | Bulgaria | 99.9 /100 | #46 | Exceptional 44.6% |
| Bolivians | 99.9 /100 | #47 | Exceptional 44.6% |
| Estonians | 99.9 /100 | #48 | Exceptional 44.6% |
| Immigrants | Norway | 99.9 /100 | #49 | Exceptional 44.5% |