Sierra Leonean vs Hungarian Single Father Poverty
COMPARE
Sierra Leonean
Hungarian
Single Father Poverty
Single Father Poverty Comparison
Sierra Leoneans
Hungarians
17.2%
SINGLE FATHER POVERTY
0.8/ 100
METRIC RATING
255th/ 347
METRIC RANK
18.5%
SINGLE FATHER POVERTY
0.0/ 100
METRIC RATING
301st/ 347
METRIC RANK
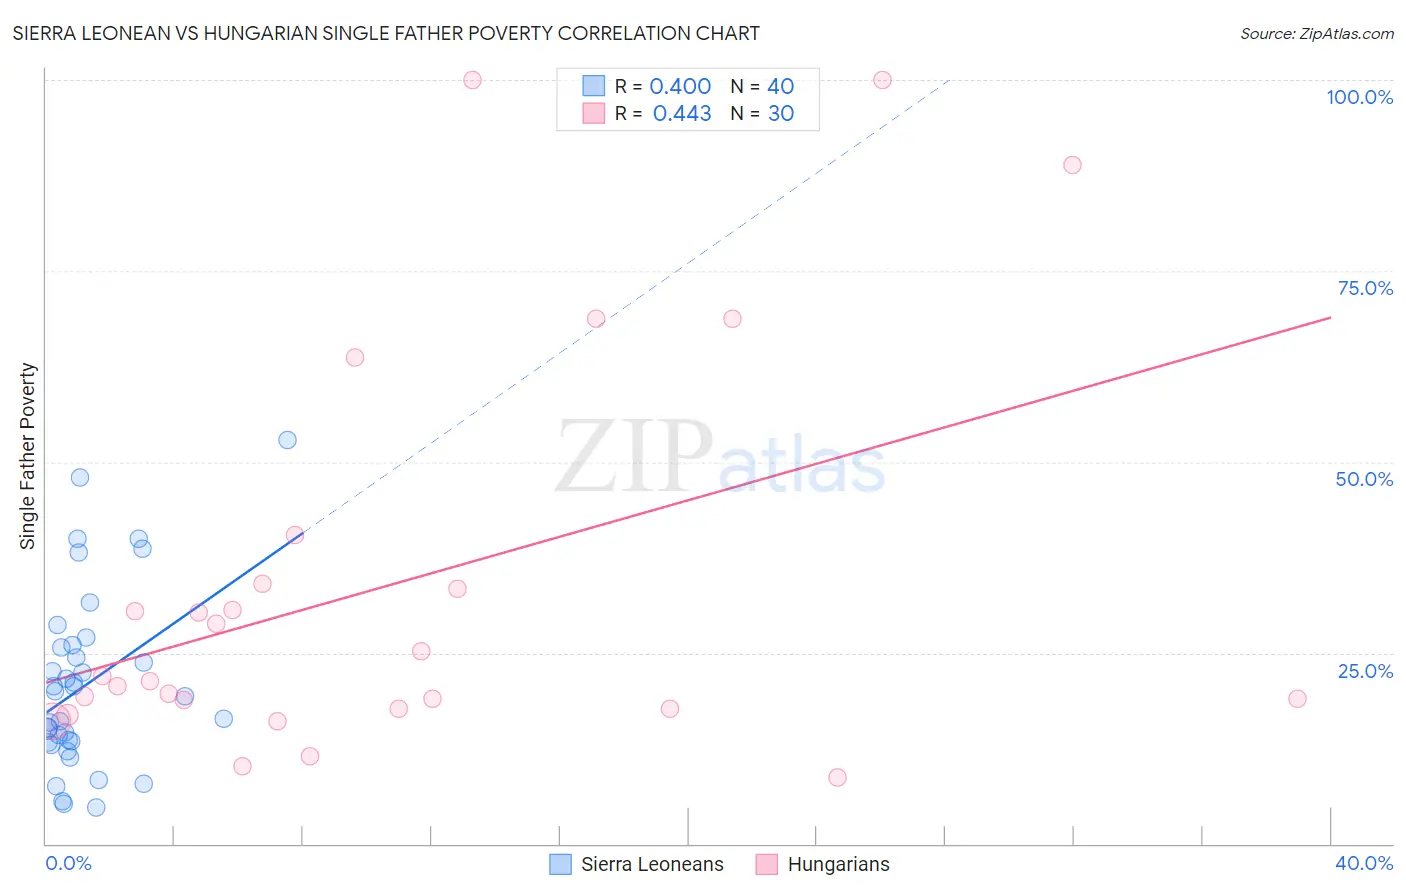
Sierra Leonean vs Hungarian Single Father Poverty Correlation Chart
The statistical analysis conducted on geographies consisting of 77,262,166 people shows a mild positive correlation between the proportion of Sierra Leoneans and poverty level among single fathers in the United States with a correlation coefficient (R) of 0.400 and weighted average of 17.2%. Similarly, the statistical analysis conducted on geographies consisting of 362,286,644 people shows a moderate positive correlation between the proportion of Hungarians and poverty level among single fathers in the United States with a correlation coefficient (R) of 0.443 and weighted average of 18.5%, a difference of 7.5%.
Single Father Poverty Correlation Summary
| Measurement | Sierra Leonean | Hungarian |
| Minimum | 4.8% | 8.6% |
| Maximum | 52.9% | 100.0% |
| Range | 48.2% | 91.4% |
| Mean | 20.9% | 33.9% |
| Median | 19.7% | 21.6% |
| Interquartile 25% (IQ1) | 13.4% | 17.7% |
| Interquartile 75% (IQ3) | 25.9% | 34.0% |
| Interquartile Range (IQR) | 12.5% | 16.3% |
| Standard Deviation (Sample) | 11.6% | 26.2% |
| Standard Deviation (Population) | 11.5% | 25.8% |
Similar Demographics by Single Father Poverty
Demographics Similar to Sierra Leoneans by Single Father Poverty
In terms of single father poverty, the demographic groups most similar to Sierra Leoneans are Immigrants from Haiti (17.2%, a difference of 0.010%), Immigrants from Albania (17.2%, a difference of 0.090%), Albanian (17.2%, a difference of 0.11%), Immigrants from Jamaica (17.2%, a difference of 0.14%), and Immigrants from Honduras (17.1%, a difference of 0.17%).
| Demographics | Rating | Rank | Single Father Poverty |
| Czechoslovakians | 1.3 /100 | #248 | Tragic 17.1% |
| Canadians | 1.3 /100 | #249 | Tragic 17.1% |
| Austrians | 1.1 /100 | #250 | Tragic 17.1% |
| Luxembourgers | 1.1 /100 | #251 | Tragic 17.1% |
| Croatians | 1.0 /100 | #252 | Tragic 17.1% |
| Cree | 1.0 /100 | #253 | Tragic 17.1% |
| Immigrants | Honduras | 0.9 /100 | #254 | Tragic 17.1% |
| Sierra Leoneans | 0.8 /100 | #255 | Tragic 17.2% |
| Immigrants | Haiti | 0.8 /100 | #256 | Tragic 17.2% |
| Immigrants | Albania | 0.7 /100 | #257 | Tragic 17.2% |
| Albanians | 0.7 /100 | #258 | Tragic 17.2% |
| Immigrants | Jamaica | 0.7 /100 | #259 | Tragic 17.2% |
| Spaniards | 0.6 /100 | #260 | Tragic 17.2% |
| Swiss | 0.5 /100 | #261 | Tragic 17.3% |
| Immigrants | Zaire | 0.4 /100 | #262 | Tragic 17.3% |
Demographics Similar to Hungarians by Single Father Poverty
In terms of single father poverty, the demographic groups most similar to Hungarians are Comanche (18.5%, a difference of 0.11%), Celtic (18.5%, a difference of 0.15%), Immigrants from Dominican Republic (18.4%, a difference of 0.22%), Ute (18.5%, a difference of 0.29%), and Blackfeet (18.5%, a difference of 0.34%).
| Demographics | Rating | Rank | Single Father Poverty |
| U.S. Virgin Islanders | 0.0 /100 | #294 | Tragic 18.1% |
| Yakama | 0.0 /100 | #295 | Tragic 18.1% |
| Seminole | 0.0 /100 | #296 | Tragic 18.1% |
| French | 0.0 /100 | #297 | Tragic 18.2% |
| Africans | 0.0 /100 | #298 | Tragic 18.3% |
| Whites/Caucasians | 0.0 /100 | #299 | Tragic 18.4% |
| Immigrants | Dominican Republic | 0.0 /100 | #300 | Tragic 18.4% |
| Hungarians | 0.0 /100 | #301 | Tragic 18.5% |
| Comanche | 0.0 /100 | #302 | Tragic 18.5% |
| Celtics | 0.0 /100 | #303 | Tragic 18.5% |
| Ute | 0.0 /100 | #304 | Tragic 18.5% |
| Blackfeet | 0.0 /100 | #305 | Tragic 18.5% |
| Scotch-Irish | 0.0 /100 | #306 | Tragic 18.6% |
| French Canadians | 0.0 /100 | #307 | Tragic 18.6% |
| Ottawa | 0.0 /100 | #308 | Tragic 18.6% |