Scotch-Irish vs Immigrants from Jordan Single Mother Poverty
COMPARE
Scotch-Irish
Immigrants from Jordan
Single Mother Poverty
Single Mother Poverty Comparison
Scotch-Irish
Immigrants from Jordan
31.5%
SINGLE MOTHER POVERTY
0.1/ 100
METRIC RATING
269th/ 347
METRIC RANK
27.1%
SINGLE MOTHER POVERTY
99.7/ 100
METRIC RATING
53rd/ 347
METRIC RANK
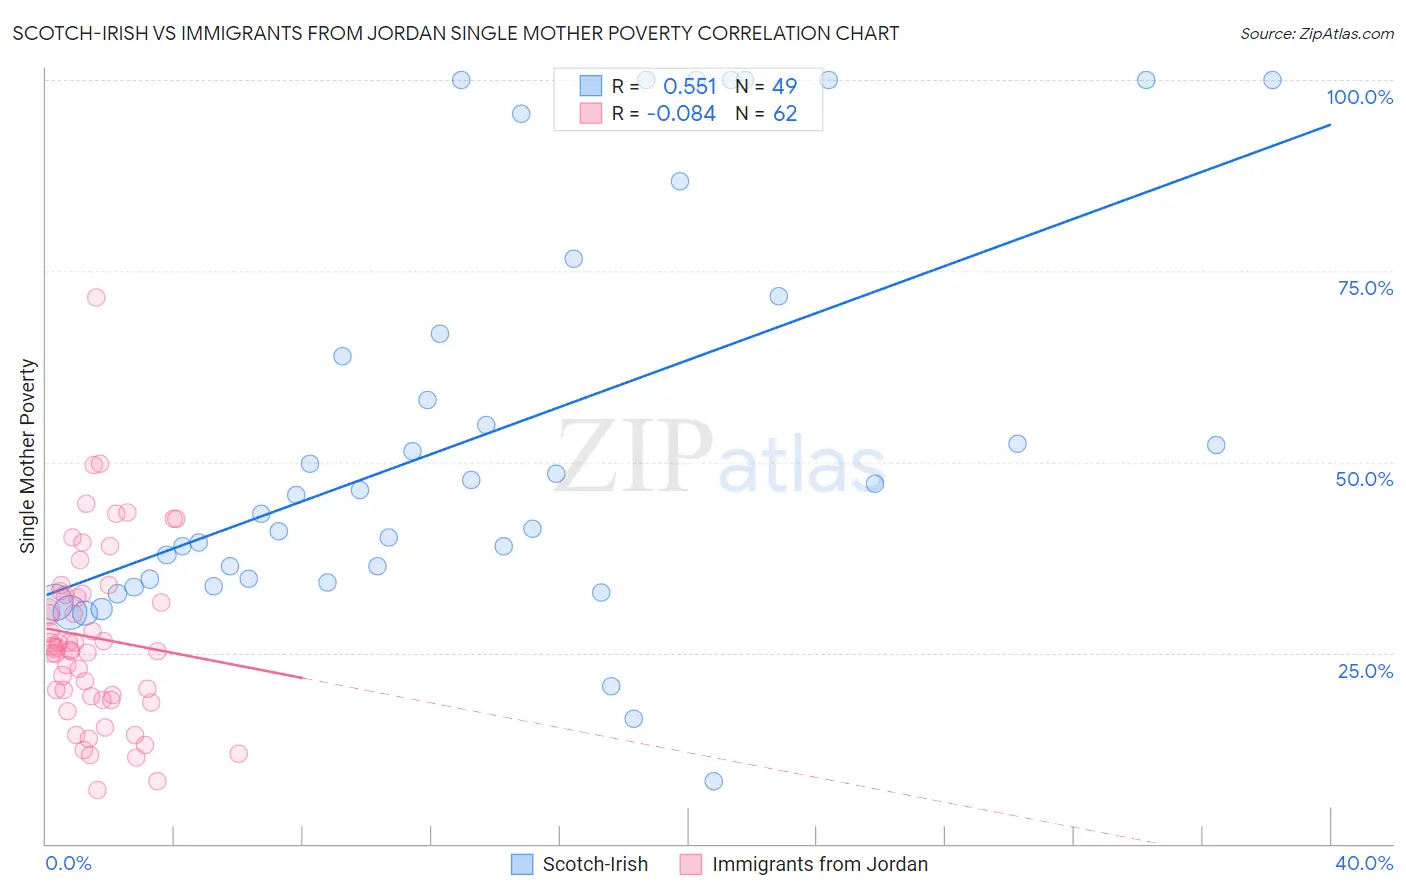
Scotch-Irish vs Immigrants from Jordan Single Mother Poverty Correlation Chart
The statistical analysis conducted on geographies consisting of 524,083,922 people shows a substantial positive correlation between the proportion of Scotch-Irish and poverty level among single mothers in the United States with a correlation coefficient (R) of 0.551 and weighted average of 31.5%. Similarly, the statistical analysis conducted on geographies consisting of 179,287,213 people shows a slight negative correlation between the proportion of Immigrants from Jordan and poverty level among single mothers in the United States with a correlation coefficient (R) of -0.084 and weighted average of 27.1%, a difference of 16.1%.
Single Mother Poverty Correlation Summary
| Measurement | Scotch-Irish | Immigrants from Jordan |
| Minimum | 8.1% | 7.0% |
| Maximum | 100.0% | 71.6% |
| Range | 91.9% | 64.5% |
| Mean | 53.3% | 27.0% |
| Median | 45.6% | 25.6% |
| Interquartile 25% (IQ1) | 34.5% | 19.4% |
| Interquartile 75% (IQ3) | 69.2% | 32.7% |
| Interquartile Range (IQR) | 34.7% | 13.3% |
| Standard Deviation (Sample) | 26.2% | 11.7% |
| Standard Deviation (Population) | 25.9% | 11.6% |
Similar Demographics by Single Mother Poverty
Demographics Similar to Scotch-Irish by Single Mother Poverty
In terms of single mother poverty, the demographic groups most similar to Scotch-Irish are Immigrants from Senegal (31.5%, a difference of 0.040%), British West Indian (31.5%, a difference of 0.050%), Immigrants from Belize (31.4%, a difference of 0.22%), Immigrants from Cabo Verde (31.6%, a difference of 0.29%), and Immigrants from Micronesia (31.6%, a difference of 0.30%).
| Demographics | Rating | Rank | Single Mother Poverty |
| Hmong | 0.3 /100 | #262 | Tragic 31.2% |
| Bahamians | 0.2 /100 | #263 | Tragic 31.3% |
| Immigrants | Ecuador | 0.2 /100 | #264 | Tragic 31.3% |
| German Russians | 0.2 /100 | #265 | Tragic 31.3% |
| Sub-Saharan Africans | 0.2 /100 | #266 | Tragic 31.4% |
| Immigrants | Belize | 0.2 /100 | #267 | Tragic 31.4% |
| Immigrants | Senegal | 0.1 /100 | #268 | Tragic 31.5% |
| Scotch-Irish | 0.1 /100 | #269 | Tragic 31.5% |
| British West Indians | 0.1 /100 | #270 | Tragic 31.5% |
| Immigrants | Cabo Verde | 0.1 /100 | #271 | Tragic 31.6% |
| Immigrants | Micronesia | 0.1 /100 | #272 | Tragic 31.6% |
| Fijians | 0.1 /100 | #273 | Tragic 31.6% |
| Bangladeshis | 0.1 /100 | #274 | Tragic 31.7% |
| Central Americans | 0.1 /100 | #275 | Tragic 31.8% |
| Delaware | 0.0 /100 | #276 | Tragic 31.8% |
Demographics Similar to Immigrants from Jordan by Single Mother Poverty
In terms of single mother poverty, the demographic groups most similar to Immigrants from Jordan are Immigrants from Bulgaria (27.1%, a difference of 0.030%), Immigrants from South Eastern Asia (27.1%, a difference of 0.040%), Immigrants from Egypt (27.1%, a difference of 0.060%), Immigrants from Argentina (27.1%, a difference of 0.080%), and Immigrants from Romania (27.2%, a difference of 0.11%).
| Demographics | Rating | Rank | Single Mother Poverty |
| Immigrants | Serbia | 99.9 /100 | #46 | Exceptional 26.9% |
| Egyptians | 99.8 /100 | #47 | Exceptional 26.9% |
| Immigrants | Poland | 99.8 /100 | #48 | Exceptional 26.9% |
| Cambodians | 99.8 /100 | #49 | Exceptional 27.0% |
| Laotians | 99.8 /100 | #50 | Exceptional 27.0% |
| Immigrants | Argentina | 99.7 /100 | #51 | Exceptional 27.1% |
| Immigrants | South Eastern Asia | 99.7 /100 | #52 | Exceptional 27.1% |
| Immigrants | Jordan | 99.7 /100 | #53 | Exceptional 27.1% |
| Immigrants | Bulgaria | 99.7 /100 | #54 | Exceptional 27.1% |
| Immigrants | Egypt | 99.7 /100 | #55 | Exceptional 27.1% |
| Immigrants | Romania | 99.7 /100 | #56 | Exceptional 27.2% |
| Palestinians | 99.7 /100 | #57 | Exceptional 27.2% |
| Argentineans | 99.6 /100 | #58 | Exceptional 27.2% |
| Paraguayans | 99.6 /100 | #59 | Exceptional 27.2% |
| Eastern Europeans | 99.6 /100 | #60 | Exceptional 27.2% |