Samoan vs Potawatomi Single Father Poverty
COMPARE
Samoan
Potawatomi
Single Father Poverty
Single Father Poverty Comparison
Samoans
Potawatomi
13.8%
SINGLE FATHER POVERTY
100.0/ 100
METRIC RATING
8th/ 347
METRIC RANK
18.9%
SINGLE FATHER POVERTY
0.0/ 100
METRIC RATING
313th/ 347
METRIC RANK
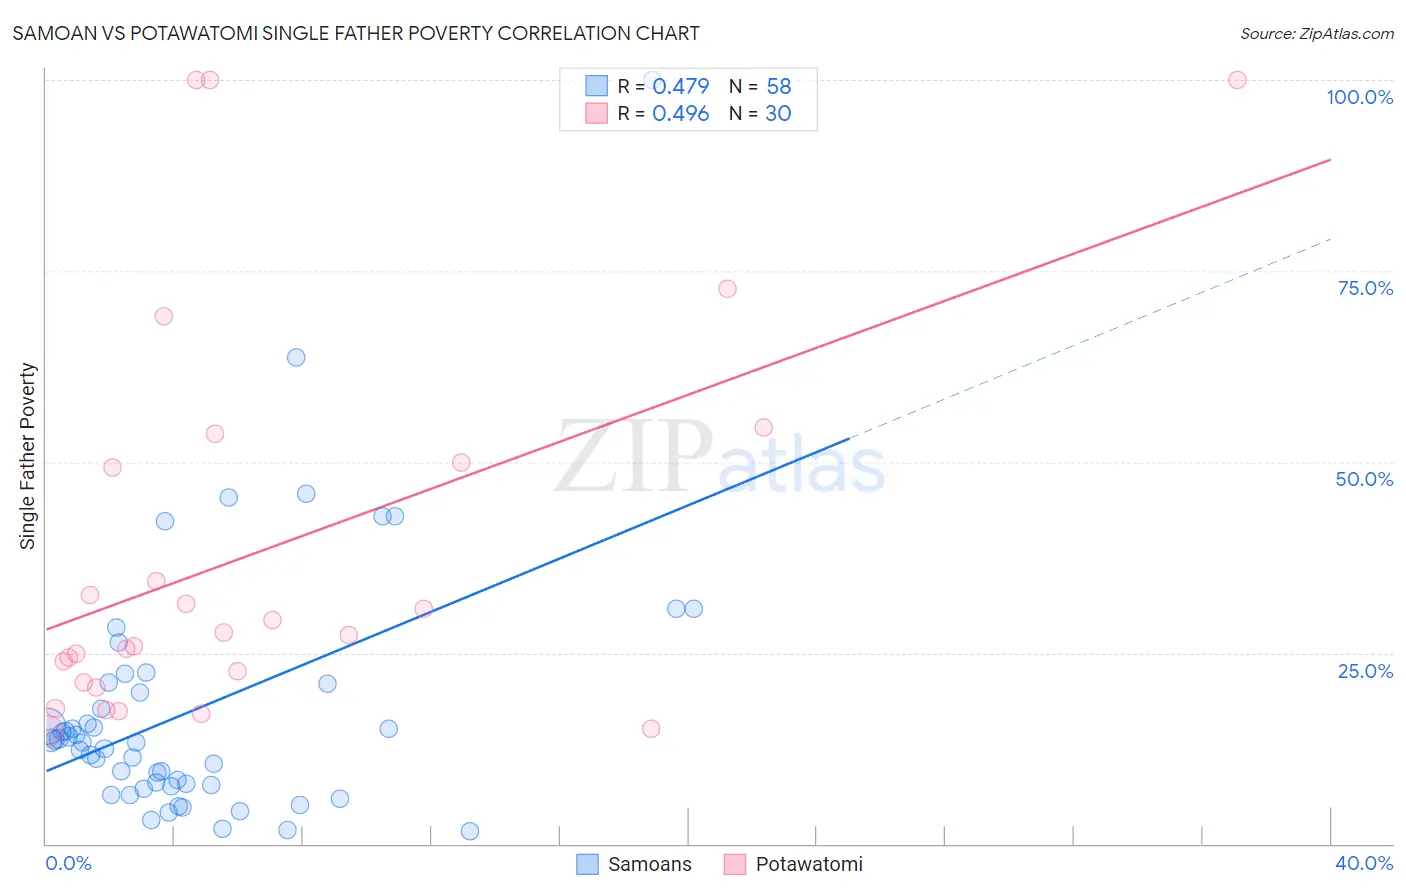
Samoan vs Potawatomi Single Father Poverty Correlation Chart
The statistical analysis conducted on geographies consisting of 195,405,703 people shows a moderate positive correlation between the proportion of Samoans and poverty level among single fathers in the United States with a correlation coefficient (R) of 0.479 and weighted average of 13.8%. Similarly, the statistical analysis conducted on geographies consisting of 106,133,326 people shows a moderate positive correlation between the proportion of Potawatomi and poverty level among single fathers in the United States with a correlation coefficient (R) of 0.496 and weighted average of 18.9%, a difference of 36.9%.
Single Father Poverty Correlation Summary
| Measurement | Samoan | Potawatomi |
| Minimum | 1.7% | 14.8% |
| Maximum | 100.0% | 100.0% |
| Range | 98.3% | 85.2% |
| Mean | 17.6% | 38.4% |
| Median | 13.4% | 27.5% |
| Interquartile 25% (IQ1) | 7.7% | 21.1% |
| Interquartile 75% (IQ3) | 20.9% | 50.0% |
| Interquartile Range (IQR) | 13.2% | 28.9% |
| Standard Deviation (Sample) | 16.9% | 25.8% |
| Standard Deviation (Population) | 16.8% | 25.4% |
Similar Demographics by Single Father Poverty
Demographics Similar to Samoans by Single Father Poverty
In terms of single father poverty, the demographic groups most similar to Samoans are Immigrants from Taiwan (13.7%, a difference of 0.86%), Afghan (14.0%, a difference of 1.1%), Korean (14.0%, a difference of 1.2%), Filipino (14.0%, a difference of 1.6%), and Immigrants from India (14.0%, a difference of 1.6%).
| Demographics | Rating | Rank | Single Father Poverty |
| Assyrians/Chaldeans/Syriacs | 100.0 /100 | #1 | Exceptional 11.7% |
| Tongans | 100.0 /100 | #2 | Exceptional 12.2% |
| Tsimshian | 100.0 /100 | #3 | Exceptional 12.7% |
| Immigrants | Fiji | 100.0 /100 | #4 | Exceptional 13.2% |
| Immigrants | Ethiopia | 100.0 /100 | #5 | Exceptional 13.4% |
| Ethiopians | 100.0 /100 | #6 | Exceptional 13.5% |
| Immigrants | Taiwan | 100.0 /100 | #7 | Exceptional 13.7% |
| Samoans | 100.0 /100 | #8 | Exceptional 13.8% |
| Afghans | 100.0 /100 | #9 | Exceptional 14.0% |
| Koreans | 100.0 /100 | #10 | Exceptional 14.0% |
| Filipinos | 100.0 /100 | #11 | Exceptional 14.0% |
| Immigrants | India | 100.0 /100 | #12 | Exceptional 14.0% |
| Immigrants | Philippines | 100.0 /100 | #13 | Exceptional 14.0% |
| Immigrants | Vietnam | 100.0 /100 | #14 | Exceptional 14.1% |
| Sri Lankans | 100.0 /100 | #15 | Exceptional 14.2% |
Demographics Similar to Potawatomi by Single Father Poverty
In terms of single father poverty, the demographic groups most similar to Potawatomi are Delaware (18.9%, a difference of 0.16%), Immigrants from Dominica (18.9%, a difference of 0.20%), Nonimmigrants (18.8%, a difference of 0.25%), Chickasaw (19.0%, a difference of 0.32%), and Chippewa (18.8%, a difference of 0.44%).
| Demographics | Rating | Rank | Single Father Poverty |
| Scotch-Irish | 0.0 /100 | #306 | Tragic 18.6% |
| French Canadians | 0.0 /100 | #307 | Tragic 18.6% |
| Ottawa | 0.0 /100 | #308 | Tragic 18.6% |
| Immigrants | Micronesia | 0.0 /100 | #309 | Tragic 18.6% |
| Chippewa | 0.0 /100 | #310 | Tragic 18.8% |
| Immigrants | Nonimmigrants | 0.0 /100 | #311 | Tragic 18.8% |
| Immigrants | Dominica | 0.0 /100 | #312 | Tragic 18.9% |
| Potawatomi | 0.0 /100 | #313 | Tragic 18.9% |
| Delaware | 0.0 /100 | #314 | Tragic 18.9% |
| Chickasaw | 0.0 /100 | #315 | Tragic 19.0% |
| Osage | 0.0 /100 | #316 | Tragic 19.0% |
| Dominicans | 0.0 /100 | #317 | Tragic 19.1% |
| Dutch West Indians | 0.0 /100 | #318 | Tragic 19.2% |
| Slovaks | 0.0 /100 | #319 | Tragic 19.3% |
| Inupiat | 0.0 /100 | #320 | Tragic 19.5% |