Samoan vs Marshallese Seniors Poverty Over the Age of 75
COMPARE
Samoan
Marshallese
Seniors Poverty Over the Age of 75
Seniors Poverty Over the Age of 75 Comparison
Samoans
Marshallese
11.1%
SENIORS POVERTY OVER THE AGE OF 75
98.7/ 100
METRIC RATING
49th/ 347
METRIC RANK
10.7%
SENIORS POVERTY OVER THE AGE OF 75
99.7/ 100
METRIC RATING
31st/ 347
METRIC RANK
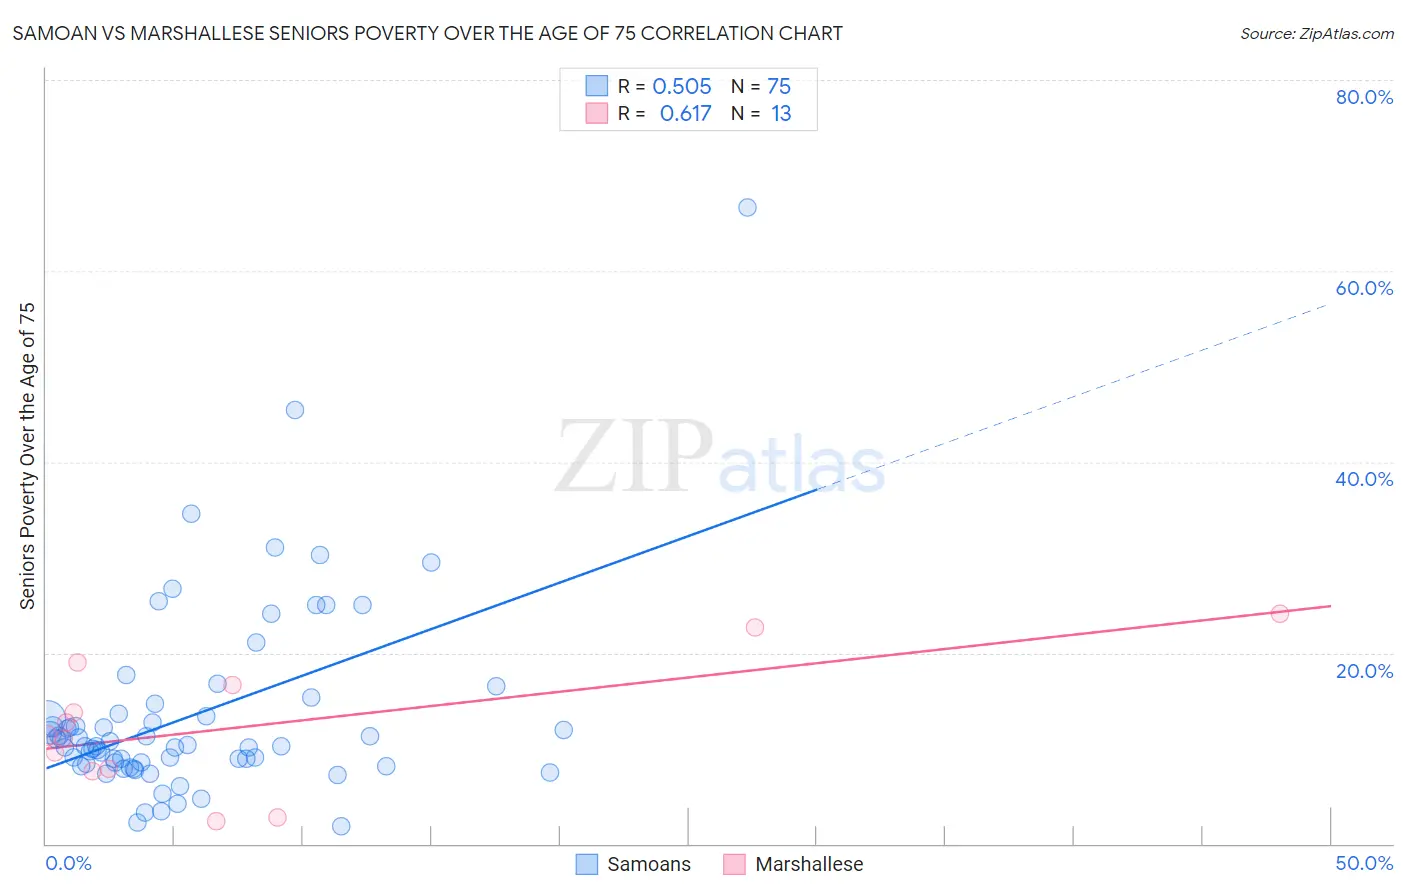
Samoan vs Marshallese Seniors Poverty Over the Age of 75 Correlation Chart
The statistical analysis conducted on geographies consisting of 223,453,504 people shows a substantial positive correlation between the proportion of Samoans and poverty level among seniors over the age of 75 in the United States with a correlation coefficient (R) of 0.505 and weighted average of 11.1%. Similarly, the statistical analysis conducted on geographies consisting of 14,729,401 people shows a significant positive correlation between the proportion of Marshallese and poverty level among seniors over the age of 75 in the United States with a correlation coefficient (R) of 0.617 and weighted average of 10.7%, a difference of 3.6%.
Seniors Poverty Over the Age of 75 Correlation Summary
| Measurement | Samoan | Marshallese |
| Minimum | 1.8% | 2.3% |
| Maximum | 66.7% | 24.1% |
| Range | 64.9% | 21.8% |
| Mean | 13.5% | 12.4% |
| Median | 10.2% | 11.3% |
| Interquartile 25% (IQ1) | 8.4% | 7.7% |
| Interquartile 75% (IQ3) | 13.6% | 17.9% |
| Interquartile Range (IQR) | 5.1% | 10.2% |
| Standard Deviation (Sample) | 10.1% | 6.8% |
| Standard Deviation (Population) | 10.0% | 6.6% |
Demographics Similar to Samoans and Marshallese by Seniors Poverty Over the Age of 75
In terms of seniors poverty over the age of 75, the demographic groups most similar to Samoans are French (11.1%, a difference of 0.11%), Serbian (11.1%, a difference of 0.11%), Hawaiian (11.1%, a difference of 0.15%), Greek (11.1%, a difference of 0.59%), and Carpatho Rusyn (11.1%, a difference of 0.66%). Similarly, the demographic groups most similar to Marshallese are British (10.7%, a difference of 0.14%), Swiss (10.7%, a difference of 0.19%), Puget Sound Salish (10.8%, a difference of 0.19%), Italian (10.8%, a difference of 0.25%), and Luxembourger (10.8%, a difference of 0.63%).
| Demographics | Rating | Rank | Seniors Poverty Over the Age of 75 |
| Swiss | 99.7 /100 | #30 | Exceptional 10.7% |
| Marshallese | 99.7 /100 | #31 | Exceptional 10.7% |
| British | 99.7 /100 | #32 | Exceptional 10.7% |
| Puget Sound Salish | 99.7 /100 | #33 | Exceptional 10.8% |
| Italians | 99.7 /100 | #34 | Exceptional 10.8% |
| Luxembourgers | 99.6 /100 | #35 | Exceptional 10.8% |
| Scotch-Irish | 99.6 /100 | #36 | Exceptional 10.8% |
| Latvians | 99.6 /100 | #37 | Exceptional 10.8% |
| Finns | 99.6 /100 | #38 | Exceptional 10.8% |
| Czechoslovakians | 99.4 /100 | #39 | Exceptional 10.9% |
| Thais | 99.4 /100 | #40 | Exceptional 10.9% |
| Immigrants | Lithuania | 99.2 /100 | #41 | Exceptional 11.0% |
| Austrians | 99.1 /100 | #42 | Exceptional 11.0% |
| Celtics | 99.1 /100 | #43 | Exceptional 11.0% |
| Belgians | 99.1 /100 | #44 | Exceptional 11.0% |
| Carpatho Rusyns | 99.0 /100 | #45 | Exceptional 11.1% |
| Greeks | 99.0 /100 | #46 | Exceptional 11.1% |
| Hawaiians | 98.8 /100 | #47 | Exceptional 11.1% |
| French | 98.7 /100 | #48 | Exceptional 11.1% |
| Samoans | 98.7 /100 | #49 | Exceptional 11.1% |
| Serbians | 98.6 /100 | #50 | Exceptional 11.1% |