Romanian vs Spanish American Child Poverty Among Boys Under 16
COMPARE
Romanian
Spanish American
Child Poverty Among Boys Under 16
Child Poverty Among Boys Under 16 Comparison
Romanians
Spanish Americans
15.0%
CHILD POVERTY AMONG BOYS UNDER 16
95.6/ 100
METRIC RATING
102nd/ 347
METRIC RANK
19.4%
CHILD POVERTY AMONG BOYS UNDER 16
0.2/ 100
METRIC RATING
259th/ 347
METRIC RANK
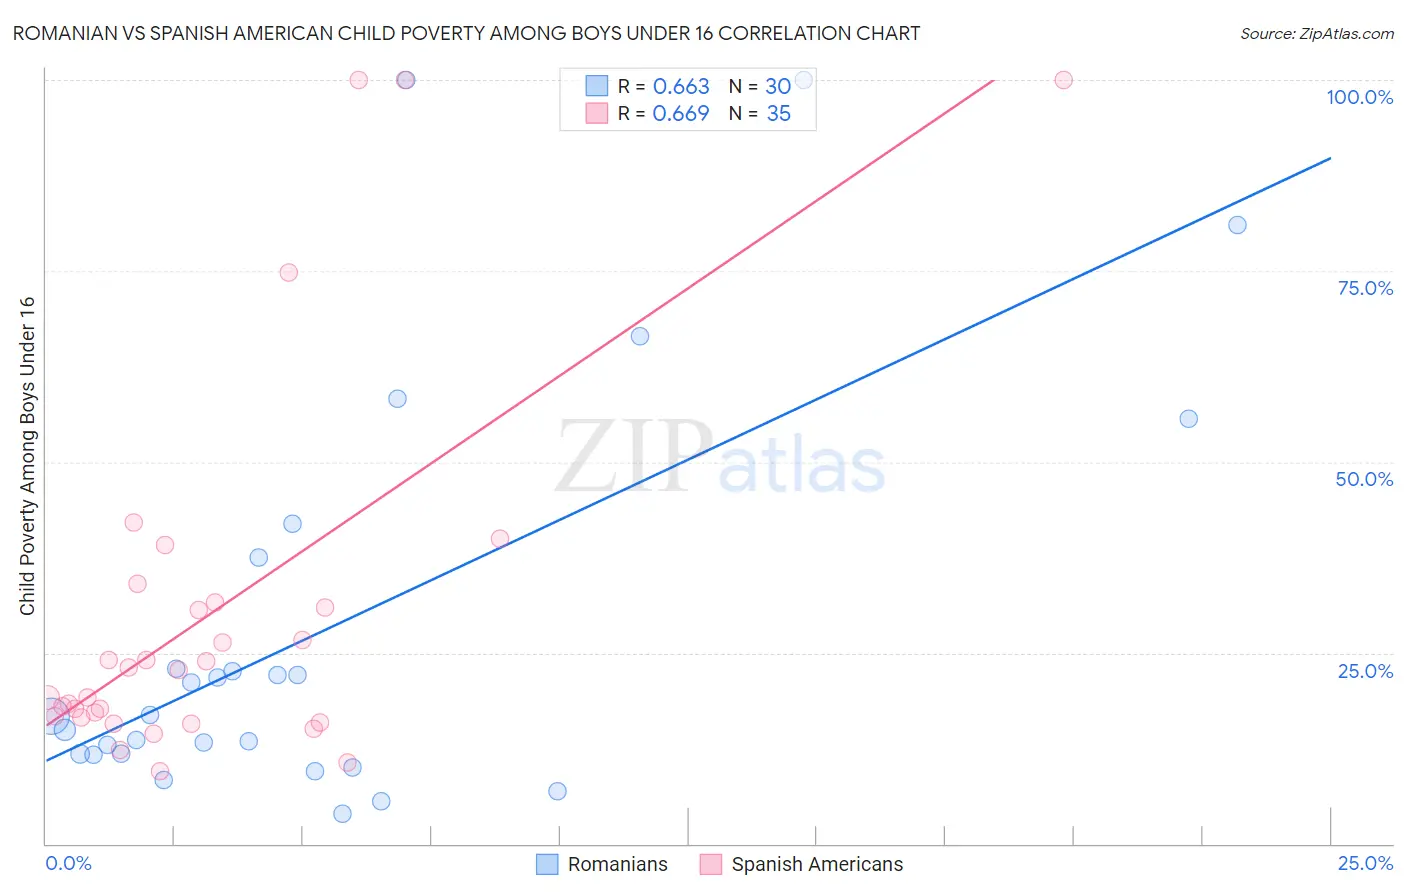
Romanian vs Spanish American Child Poverty Among Boys Under 16 Correlation Chart
The statistical analysis conducted on geographies consisting of 370,969,590 people shows a significant positive correlation between the proportion of Romanians and poverty level among boys under the age of 16 in the United States with a correlation coefficient (R) of 0.663 and weighted average of 15.0%. Similarly, the statistical analysis conducted on geographies consisting of 102,814,034 people shows a significant positive correlation between the proportion of Spanish Americans and poverty level among boys under the age of 16 in the United States with a correlation coefficient (R) of 0.669 and weighted average of 19.4%, a difference of 29.0%.
Child Poverty Among Boys Under 16 Correlation Summary
| Measurement | Romanian | Spanish American |
| Minimum | 4.0% | 9.5% |
| Maximum | 100.0% | 100.0% |
| Range | 96.0% | 90.5% |
| Mean | 28.5% | 30.4% |
| Median | 16.7% | 22.8% |
| Interquartile 25% (IQ1) | 11.8% | 16.5% |
| Interquartile 75% (IQ3) | 37.4% | 31.5% |
| Interquartile Range (IQR) | 25.7% | 15.0% |
| Standard Deviation (Sample) | 27.2% | 24.7% |
| Standard Deviation (Population) | 26.8% | 24.4% |
Similar Demographics by Child Poverty Among Boys Under 16
Demographics Similar to Romanians by Child Poverty Among Boys Under 16
In terms of child poverty among boys under 16, the demographic groups most similar to Romanians are Immigrants from Denmark (15.0%, a difference of 0.040%), Immigrants from Belarus (15.0%, a difference of 0.070%), Chilean (15.0%, a difference of 0.13%), Immigrants from Switzerland (15.0%, a difference of 0.14%), and Dutch (15.0%, a difference of 0.15%).
| Demographics | Rating | Rank | Child Poverty Among Boys Under 16 |
| Finns | 96.5 /100 | #95 | Exceptional 14.9% |
| Immigrants | North Macedonia | 96.3 /100 | #96 | Exceptional 14.9% |
| Immigrants | Egypt | 96.2 /100 | #97 | Exceptional 14.9% |
| British | 96.2 /100 | #98 | Exceptional 15.0% |
| Immigrants | France | 96.1 /100 | #99 | Exceptional 15.0% |
| Chileans | 95.8 /100 | #100 | Exceptional 15.0% |
| Immigrants | Belarus | 95.7 /100 | #101 | Exceptional 15.0% |
| Romanians | 95.6 /100 | #102 | Exceptional 15.0% |
| Immigrants | Denmark | 95.6 /100 | #103 | Exceptional 15.0% |
| Immigrants | Switzerland | 95.4 /100 | #104 | Exceptional 15.0% |
| Dutch | 95.4 /100 | #105 | Exceptional 15.0% |
| Serbians | 95.2 /100 | #106 | Exceptional 15.1% |
| Jordanians | 95.1 /100 | #107 | Exceptional 15.1% |
| Immigrants | England | 94.8 /100 | #108 | Exceptional 15.1% |
| Pakistanis | 94.7 /100 | #109 | Exceptional 15.1% |
Demographics Similar to Spanish Americans by Child Poverty Among Boys Under 16
In terms of child poverty among boys under 16, the demographic groups most similar to Spanish Americans are Potawatomi (19.4%, a difference of 0.020%), Mexican American Indian (19.4%, a difference of 0.030%), Shoshone (19.4%, a difference of 0.10%), Immigrants from Ghana (19.4%, a difference of 0.12%), and Immigrants from Liberia (19.3%, a difference of 0.24%).
| Demographics | Rating | Rank | Child Poverty Among Boys Under 16 |
| Immigrants | Western Africa | 0.2 /100 | #252 | Tragic 19.3% |
| Liberians | 0.2 /100 | #253 | Tragic 19.3% |
| Trinidadians and Tobagonians | 0.2 /100 | #254 | Tragic 19.3% |
| Ecuadorians | 0.2 /100 | #255 | Tragic 19.3% |
| Immigrants | Liberia | 0.2 /100 | #256 | Tragic 19.3% |
| Mexican American Indians | 0.2 /100 | #257 | Tragic 19.4% |
| Potawatomi | 0.2 /100 | #258 | Tragic 19.4% |
| Spanish Americans | 0.2 /100 | #259 | Tragic 19.4% |
| Shoshone | 0.2 /100 | #260 | Tragic 19.4% |
| Immigrants | Ghana | 0.2 /100 | #261 | Tragic 19.4% |
| Immigrants | Guyana | 0.1 /100 | #262 | Tragic 19.5% |
| Ottawa | 0.1 /100 | #263 | Tragic 19.5% |
| Iroquois | 0.1 /100 | #264 | Tragic 19.6% |
| Guyanese | 0.1 /100 | #265 | Tragic 19.6% |
| Immigrants | El Salvador | 0.1 /100 | #266 | Tragic 19.6% |