Pueblo vs Immigrants from Caribbean Single Male Poverty
COMPARE
Pueblo
Immigrants from Caribbean
Single Male Poverty
Single Male Poverty Comparison
Pueblo
Immigrants from Caribbean
21.6%
SINGLE MALE POVERTY
0.0/ 100
METRIC RATING
338th/ 347
METRIC RANK
13.3%
SINGLE MALE POVERTY
5.0/ 100
METRIC RATING
232nd/ 347
METRIC RANK
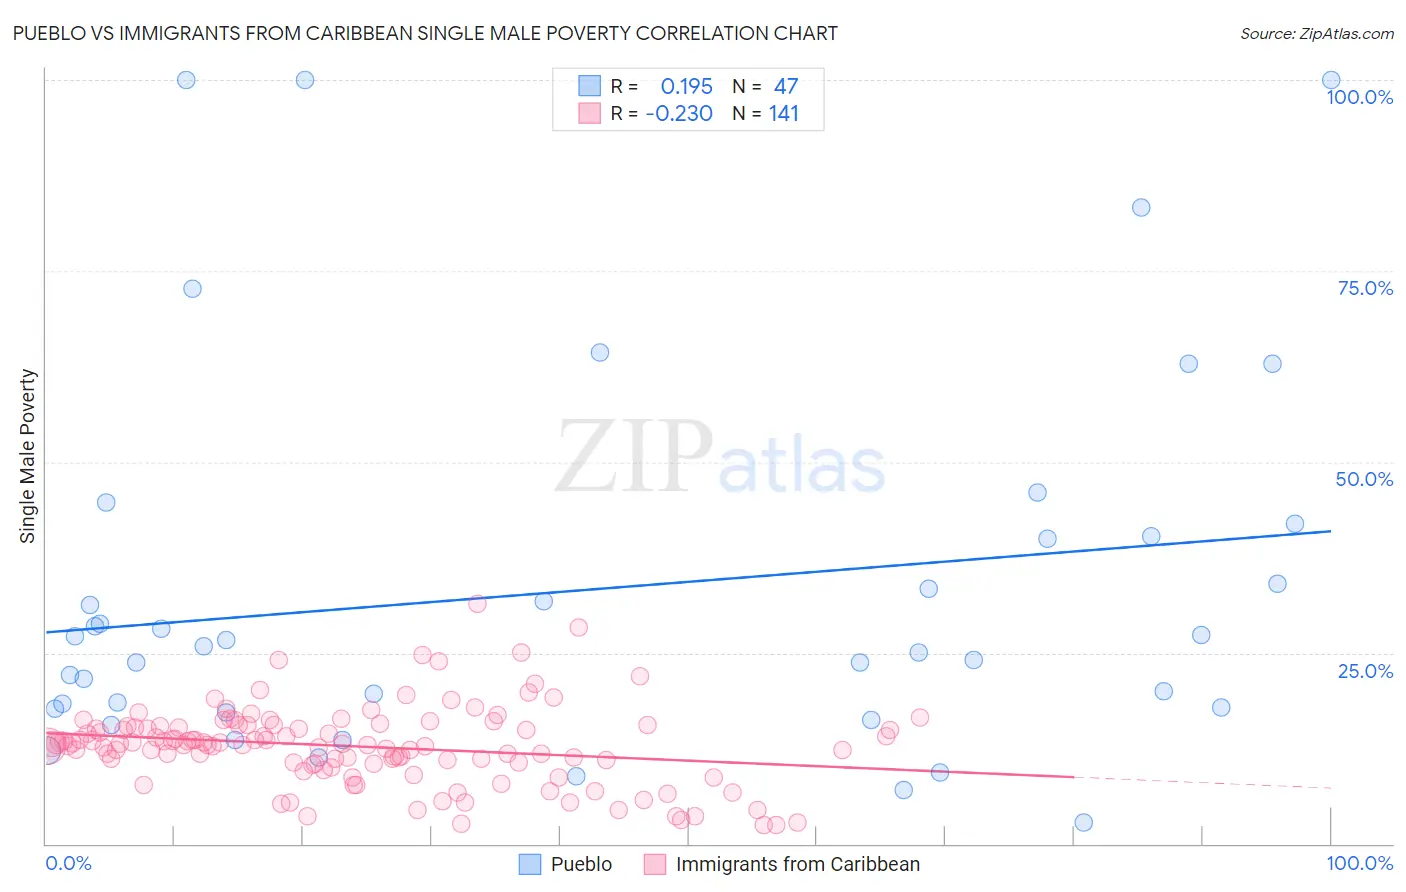
Pueblo vs Immigrants from Caribbean Single Male Poverty Correlation Chart
The statistical analysis conducted on geographies consisting of 115,485,335 people shows a poor positive correlation between the proportion of Pueblo and poverty level among single males in the United States with a correlation coefficient (R) of 0.195 and weighted average of 21.6%. Similarly, the statistical analysis conducted on geographies consisting of 393,892,998 people shows a weak negative correlation between the proportion of Immigrants from Caribbean and poverty level among single males in the United States with a correlation coefficient (R) of -0.230 and weighted average of 13.3%, a difference of 62.6%.
Single Male Poverty Correlation Summary
| Measurement | Pueblo | Immigrants from Caribbean |
| Minimum | 2.9% | 2.4% |
| Maximum | 100.0% | 31.5% |
| Range | 97.1% | 29.0% |
| Mean | 33.2% | 12.8% |
| Median | 25.9% | 13.0% |
| Interquartile 25% (IQ1) | 17.7% | 10.5% |
| Interquartile 75% (IQ3) | 40.2% | 15.4% |
| Interquartile Range (IQR) | 22.5% | 4.9% |
| Standard Deviation (Sample) | 24.7% | 5.1% |
| Standard Deviation (Population) | 24.4% | 5.1% |
Similar Demographics by Single Male Poverty
Demographics Similar to Pueblo by Single Male Poverty
In terms of single male poverty, the demographic groups most similar to Pueblo are Apache (21.6%, a difference of 0.18%), Tohono O'odham (21.6%, a difference of 0.28%), Yuman (21.3%, a difference of 1.5%), Arapaho (21.9%, a difference of 1.5%), and Sioux (22.2%, a difference of 2.8%).
| Demographics | Rating | Rank | Single Male Poverty |
| Paiute | 0.0 /100 | #331 | Tragic 19.3% |
| Natives/Alaskans | 0.0 /100 | #332 | Tragic 19.6% |
| Inupiat | 0.0 /100 | #333 | Tragic 20.0% |
| Pima | 0.0 /100 | #334 | Tragic 20.2% |
| Yuman | 0.0 /100 | #335 | Tragic 21.3% |
| Tohono O'odham | 0.0 /100 | #336 | Tragic 21.6% |
| Apache | 0.0 /100 | #337 | Tragic 21.6% |
| Pueblo | 0.0 /100 | #338 | Tragic 21.6% |
| Arapaho | 0.0 /100 | #339 | Tragic 21.9% |
| Sioux | 0.0 /100 | #340 | Tragic 22.2% |
| Crow | 0.0 /100 | #341 | Tragic 23.3% |
| Houma | 0.0 /100 | #342 | Tragic 23.5% |
| Puerto Ricans | 0.0 /100 | #343 | Tragic 25.1% |
| Lumbee | 0.0 /100 | #344 | Tragic 25.2% |
| Navajo | 0.0 /100 | #345 | Tragic 25.3% |
Demographics Similar to Immigrants from Caribbean by Single Male Poverty
In terms of single male poverty, the demographic groups most similar to Immigrants from Caribbean are Slavic (13.3%, a difference of 0.090%), Ghanaian (13.3%, a difference of 0.27%), British (13.3%, a difference of 0.29%), Canadian (13.3%, a difference of 0.29%), and European (13.3%, a difference of 0.30%).
| Demographics | Rating | Rank | Single Male Poverty |
| Immigrants | Denmark | 8.7 /100 | #225 | Tragic 13.2% |
| Jamaicans | 7.7 /100 | #226 | Tragic 13.2% |
| Haitians | 7.0 /100 | #227 | Tragic 13.2% |
| Lebanese | 6.6 /100 | #228 | Tragic 13.2% |
| Europeans | 6.2 /100 | #229 | Tragic 13.3% |
| Ghanaians | 6.1 /100 | #230 | Tragic 13.3% |
| Slavs | 5.3 /100 | #231 | Tragic 13.3% |
| Immigrants | Caribbean | 5.0 /100 | #232 | Tragic 13.3% |
| British | 4.0 /100 | #233 | Tragic 13.3% |
| Canadians | 4.0 /100 | #234 | Tragic 13.3% |
| Bangladeshis | 3.7 /100 | #235 | Tragic 13.3% |
| Luxembourgers | 3.6 /100 | #236 | Tragic 13.4% |
| British West Indians | 3.4 /100 | #237 | Tragic 13.4% |
| Immigrants | Ghana | 3.2 /100 | #238 | Tragic 13.4% |
| Czechoslovakians | 3.0 /100 | #239 | Tragic 13.4% |