Pueblo vs Asian Single Male Poverty
COMPARE
Pueblo
Asian
Single Male Poverty
Single Male Poverty Comparison
Pueblo
Asians
21.6%
SINGLE MALE POVERTY
0.0/ 100
METRIC RATING
338th/ 347
METRIC RANK
11.2%
SINGLE MALE POVERTY
100.0/ 100
METRIC RATING
21st/ 347
METRIC RANK
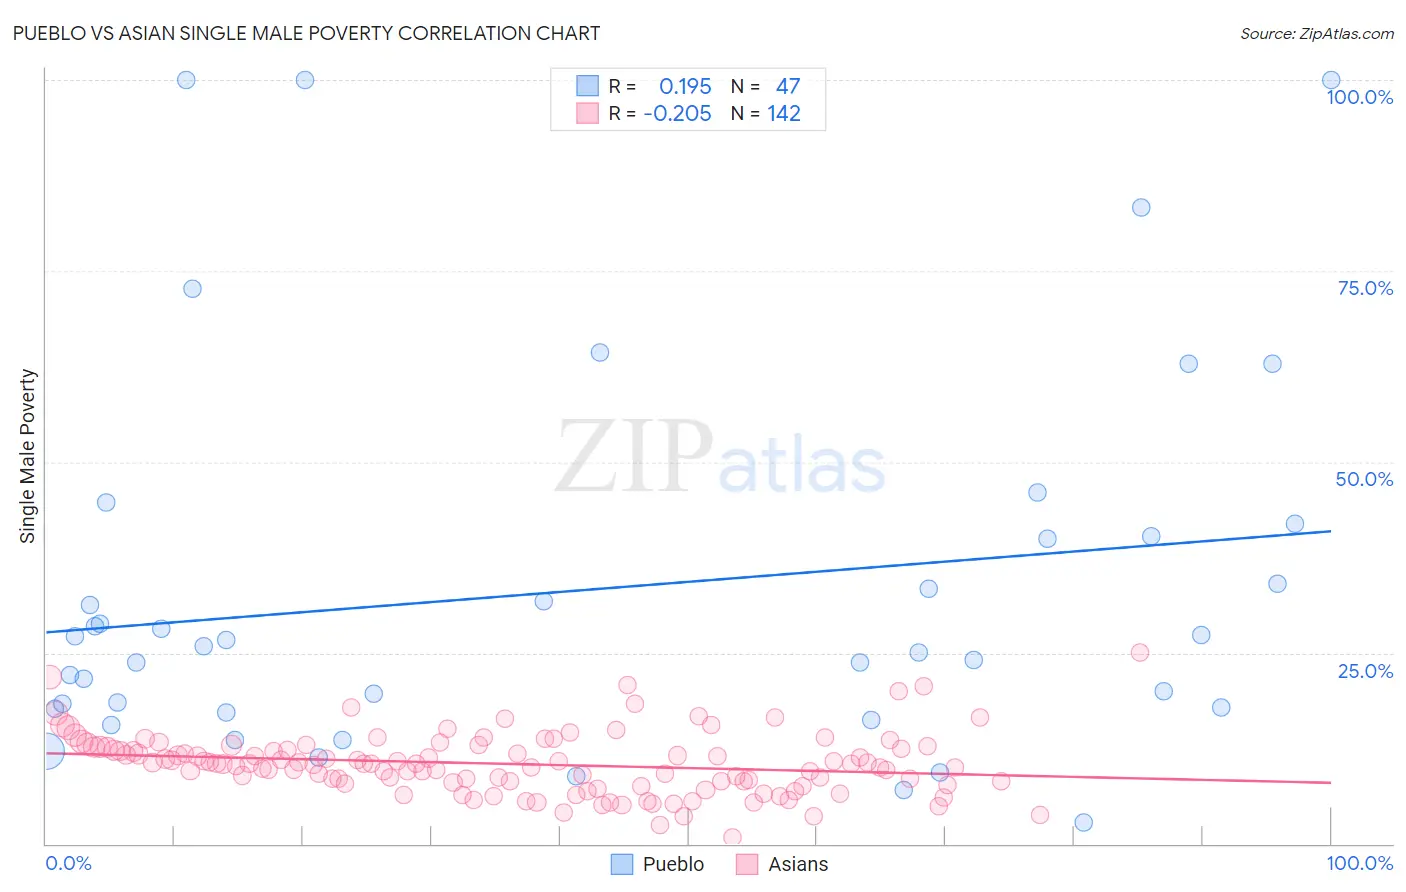
Pueblo vs Asian Single Male Poverty Correlation Chart
The statistical analysis conducted on geographies consisting of 115,485,335 people shows a poor positive correlation between the proportion of Pueblo and poverty level among single males in the United States with a correlation coefficient (R) of 0.195 and weighted average of 21.6%. Similarly, the statistical analysis conducted on geographies consisting of 462,594,480 people shows a weak negative correlation between the proportion of Asians and poverty level among single males in the United States with a correlation coefficient (R) of -0.205 and weighted average of 11.2%, a difference of 92.9%.
Single Male Poverty Correlation Summary
| Measurement | Pueblo | Asian |
| Minimum | 2.9% | 0.83% |
| Maximum | 100.0% | 25.0% |
| Range | 97.1% | 24.2% |
| Mean | 33.2% | 10.5% |
| Median | 25.9% | 10.5% |
| Interquartile 25% (IQ1) | 17.7% | 8.1% |
| Interquartile 75% (IQ3) | 40.2% | 12.7% |
| Interquartile Range (IQR) | 22.5% | 4.6% |
| Standard Deviation (Sample) | 24.7% | 4.0% |
| Standard Deviation (Population) | 24.4% | 4.0% |
Similar Demographics by Single Male Poverty
Demographics Similar to Pueblo by Single Male Poverty
In terms of single male poverty, the demographic groups most similar to Pueblo are Apache (21.6%, a difference of 0.18%), Tohono O'odham (21.6%, a difference of 0.28%), Yuman (21.3%, a difference of 1.5%), Arapaho (21.9%, a difference of 1.5%), and Sioux (22.2%, a difference of 2.8%).
| Demographics | Rating | Rank | Single Male Poverty |
| Paiute | 0.0 /100 | #331 | Tragic 19.3% |
| Natives/Alaskans | 0.0 /100 | #332 | Tragic 19.6% |
| Inupiat | 0.0 /100 | #333 | Tragic 20.0% |
| Pima | 0.0 /100 | #334 | Tragic 20.2% |
| Yuman | 0.0 /100 | #335 | Tragic 21.3% |
| Tohono O'odham | 0.0 /100 | #336 | Tragic 21.6% |
| Apache | 0.0 /100 | #337 | Tragic 21.6% |
| Pueblo | 0.0 /100 | #338 | Tragic 21.6% |
| Arapaho | 0.0 /100 | #339 | Tragic 21.9% |
| Sioux | 0.0 /100 | #340 | Tragic 22.2% |
| Crow | 0.0 /100 | #341 | Tragic 23.3% |
| Houma | 0.0 /100 | #342 | Tragic 23.5% |
| Puerto Ricans | 0.0 /100 | #343 | Tragic 25.1% |
| Lumbee | 0.0 /100 | #344 | Tragic 25.2% |
| Navajo | 0.0 /100 | #345 | Tragic 25.3% |
Demographics Similar to Asians by Single Male Poverty
In terms of single male poverty, the demographic groups most similar to Asians are Immigrants from Pakistan (11.2%, a difference of 0.090%), Bolivian (11.2%, a difference of 0.30%), Ethiopian (11.2%, a difference of 0.34%), Immigrants from Moldova (11.2%, a difference of 0.37%), and Indian (Asian) (11.3%, a difference of 0.50%).
| Demographics | Rating | Rank | Single Male Poverty |
| Chinese | 100.0 /100 | #14 | Exceptional 11.0% |
| Koreans | 100.0 /100 | #15 | Exceptional 11.0% |
| Bhutanese | 100.0 /100 | #16 | Exceptional 11.1% |
| Tsimshian | 100.0 /100 | #17 | Exceptional 11.1% |
| Immigrants | Bolivia | 100.0 /100 | #18 | Exceptional 11.1% |
| Immigrants | Moldova | 100.0 /100 | #19 | Exceptional 11.2% |
| Ethiopians | 100.0 /100 | #20 | Exceptional 11.2% |
| Asians | 100.0 /100 | #21 | Exceptional 11.2% |
| Immigrants | Pakistan | 100.0 /100 | #22 | Exceptional 11.2% |
| Bolivians | 100.0 /100 | #23 | Exceptional 11.2% |
| Indians (Asian) | 100.0 /100 | #24 | Exceptional 11.3% |
| Maltese | 100.0 /100 | #25 | Exceptional 11.3% |
| Immigrants | Japan | 100.0 /100 | #26 | Exceptional 11.3% |
| Immigrants | China | 100.0 /100 | #27 | Exceptional 11.4% |
| Immigrants | Asia | 100.0 /100 | #28 | Exceptional 11.4% |