Pakistani vs Immigrants from Malaysia Child Poverty Under the Age of 5

COMPARE

Pakistani
Race
Ancestry
AfghanAfricanAlaska NativeAlaskan AthabascanAlbanianAleutAlsatianAmericanApacheArabArapahoArgentineanArmenianAssyrian/Chaldean/SyriacAustralianAustrianBahamianBangladeshiBarbadianBasqueBelgianBelizeanBermudanBhutaneseBlackfeetBolivianBrazilianBritishBritish West IndianBulgarianBurmeseCajunCambodianCanadianCape VerdeanCarpatho RusynCelticCentral AmericanCentral American IndianCherokeeCheyenneChickasawChileanChineseChippewaChoctawColombianColvilleComancheCosta RicanCreeCreekCroatianCrowCubanCypriotCzechCzechoslovakianDanishDelawareDominicanDutchDutch West IndianEastern EuropeanEcuadorianEgyptianEnglishEstonianEthiopianEuropeanFijianFilipinoFinnishFrenchFrench American IndianFrench CanadianGermanGerman RussianGhanaianGreekGuamanian/ChamorroGuatemalanGuyaneseHaitianHmongHonduranHopiHoumaHungarianIcelanderIndian (Asian)IndonesianInupiatIranianIraqiIrishIroquoisIsraeliItalianJamaicanJapaneseJordanianKenyanKiowaKoreanLaotianLatvianLebaneseLiberianLithuanianLumbeeLuxembourgerMacedonianMalaysianMalteseMarshalleseMenomineeMexicanMexican American IndianMongolianMoroccanNative HawaiianNavajoNepaleseNew ZealanderNicaraguanNigerianNorthern EuropeanNorwegianOkinawanOsageOttawaPaiutePakistaniPalestinianPanamanianParaguayanPennsylvania GermanPeruvianPimaPolishPortuguesePotawatomiPuebloPuerto RicanPuget Sound SalishRomanianRussianSalvadoranSamoanScandinavianScotch-IrishScottishSeminoleSenegaleseSerbianShoshoneSierra LeoneanSiouxSlavicSlovakSloveneSomaliSouth AfricanSouth AmericanSouth American IndianSoviet UnionSpaniardSpanishSpanish AmericanSpanish American IndianSri LankanSubsaharan AfricanSudaneseSwedishSwissSyrianTaiwaneseThaiTlingit-HaidaTohono O'OdhamTonganTrinidadian and TobagonianTsimshianTurkishU.S. Virgin IslanderUgandanUkrainianUruguayanUteVenezuelanVietnameseWelshWest IndianYakamaYaquiYugoslavianYumanYup'ikZimbabwean
Immigration
NonimmigrantsImmigrantsAfghanistanAfricaAlbaniaArgentinaArmeniaAsiaAustraliaAustriaBahamasBangladeshBarbadosBelarusBelgiumBelizeBoliviaBosnia and HerzegovinaBrazilBulgariaBurma/MyanmarCabo VerdeCambodiaCameroonCanadaCaribbeanCentral AmericaChileChinaColombiaCongoCosta RicaCroatiaCubaCzechoslovakiaDenmarkDominicaDominican RepublicEastern AfricaEastern AsiaEastern EuropeEcuadorEgyptEl SalvadorEnglandEritreaEthiopiaEuropeFijiFranceGermanyGhanaGreeceGrenadaGuatemalaGuyanaHaitiHondurasHong KongHungaryIndiaIndonesiaIranIraqIrelandIsraelItalyJamaicaJapanJordanKazakhstanKenyaKoreaKuwaitLaosLatin AmericaLatviaLebanonLiberiaLithuaniaMexicoMicronesiaMiddle AfricaMoldovaMoroccoNepalNetherlandsNicaraguaNigeriaNorth AmericaNorth MacedoniaNorthern AfricaNorthern EuropeNorwayOceaniaPakistanPanamaPeruPhilippinesPolandPortugalRomaniaRussiaSaudi ArabiaScotlandSenegalSerbiaSierra LeoneSingaporeSomaliaSouth AfricaSouth AmericaSouth Central AsiaSouth Eastern AsiaSouthern EuropeSpainSri LankaSt. Vincent and the GrenadinesSudanSwedenSwitzerlandSyriaTaiwanThailandTrinidad and TobagoTurkeyUgandaUkraineUruguayUzbekistanVenezuelaVietnamWest IndiesWestern AfricaWestern AsiaWestern EuropeYemenZaireZimbabweAzores
Immigrants from Malaysia
Race
Ancestry
AfghanAfricanAlaska NativeAlaskan AthabascanAlbanianAleutAlsatianAmericanApacheArabArapahoArgentineanArmenianAssyrian/Chaldean/SyriacAustralianAustrianBahamianBangladeshiBarbadianBasqueBelgianBelizeanBermudanBhutaneseBlackfeetBolivianBrazilianBritishBritish West IndianBulgarianBurmeseCajunCambodianCanadianCape VerdeanCarpatho RusynCelticCentral AmericanCentral American IndianCherokeeCheyenneChickasawChileanChineseChippewaChoctawColombianColvilleComancheCosta RicanCreeCreekCroatianCrowCubanCypriotCzechCzechoslovakianDanishDelawareDominicanDutchDutch West IndianEastern EuropeanEcuadorianEgyptianEnglishEstonianEthiopianEuropeanFijianFilipinoFinnishFrenchFrench American IndianFrench CanadianGermanGerman RussianGhanaianGreekGuamanian/ChamorroGuatemalanGuyaneseHaitianHmongHonduranHopiHoumaHungarianIcelanderIndian (Asian)IndonesianInupiatIranianIraqiIrishIroquoisIsraeliItalianJamaicanJapaneseJordanianKenyanKiowaKoreanLaotianLatvianLebaneseLiberianLithuanianLumbeeLuxembourgerMacedonianMalaysianMalteseMarshalleseMenomineeMexicanMexican American IndianMongolianMoroccanNative HawaiianNavajoNepaleseNew ZealanderNicaraguanNigerianNorthern EuropeanNorwegianOkinawanOsageOttawaPaiutePalestinianPanamanianParaguayanPennsylvania GermanPeruvianPimaPolishPortuguesePotawatomiPuebloPuerto RicanPuget Sound SalishRomanianRussianSalvadoranSamoanScandinavianScotch-IrishScottishSeminoleSenegaleseSerbianShoshoneSierra LeoneanSiouxSlavicSlovakSloveneSomaliSouth AfricanSouth AmericanSouth American IndianSoviet UnionSpaniardSpanishSpanish AmericanSpanish American IndianSri LankanSubsaharan AfricanSudaneseSwedishSwissSyrianTaiwaneseThaiTlingit-HaidaTohono O'OdhamTonganTrinidadian and TobagonianTsimshianTurkishU.S. Virgin IslanderUgandanUkrainianUruguayanUteVenezuelanVietnameseWelshWest IndianYakamaYaquiYugoslavianYumanYup'ikZimbabwean
Immigration
NonimmigrantsImmigrantsAfghanistanAfricaAlbaniaArgentinaArmeniaAsiaAustraliaAustriaBahamasBangladeshBarbadosBelarusBelgiumBelizeBoliviaBosnia and HerzegovinaBrazilBulgariaBurma/MyanmarCabo VerdeCambodiaCameroonCanadaCaribbeanCentral AmericaChileChinaColombiaCongoCosta RicaCroatiaCubaCzechoslovakiaDenmarkDominicaDominican RepublicEastern AfricaEastern AsiaEastern EuropeEcuadorEgyptEl SalvadorEnglandEritreaEthiopiaEuropeFijiFranceGermanyGhanaGreeceGrenadaGuatemalaGuyanaHaitiHondurasHong KongHungaryIndiaIndonesiaIranIraqIrelandIsraelItalyJamaicaJapanJordanKazakhstanKenyaKoreaKuwaitLaosLatin AmericaLatviaLebanonLiberiaLithuaniaMalaysiaMexicoMicronesiaMiddle AfricaMoldovaMoroccoNepalNetherlandsNicaraguaNigeriaNorth AmericaNorth MacedoniaNorthern AfricaNorthern EuropeNorwayOceaniaPakistanPanamaPeruPhilippinesPolandPortugalRomaniaRussiaSaudi ArabiaScotlandSenegalSerbiaSierra LeoneSingaporeSomaliaSouth AfricaSouth AmericaSouth Central AsiaSouth Eastern AsiaSouthern EuropeSpainSri LankaSt. Vincent and the GrenadinesSudanSwedenSwitzerlandSyriaTaiwanThailandTrinidad and TobagoTurkeyUgandaUkraineUruguayUzbekistanVenezuelaVietnamWest IndiesWestern AfricaWestern AsiaWestern EuropeYemenZaireZimbabweAzores
Child Poverty Under the Age of 5
Income
Poverty
Unemployment
Labor Participation
Family Structure
Vehicle Availability
Education Level
Disability

Child Poverty Under the Age of 5 Comparison

Pakistanis

Immigrants from Malaysia

Exceptional
Exceptional
16.0%
CHILD POVERTY UNDER THE AGE OF 5
94.2/ 100
METRIC RATING
111th/ 347
METRIC RANK
15.6%
CHILD POVERTY UNDER THE AGE OF 5
97.4/ 100
METRIC RATING
86th/ 347
METRIC RANK

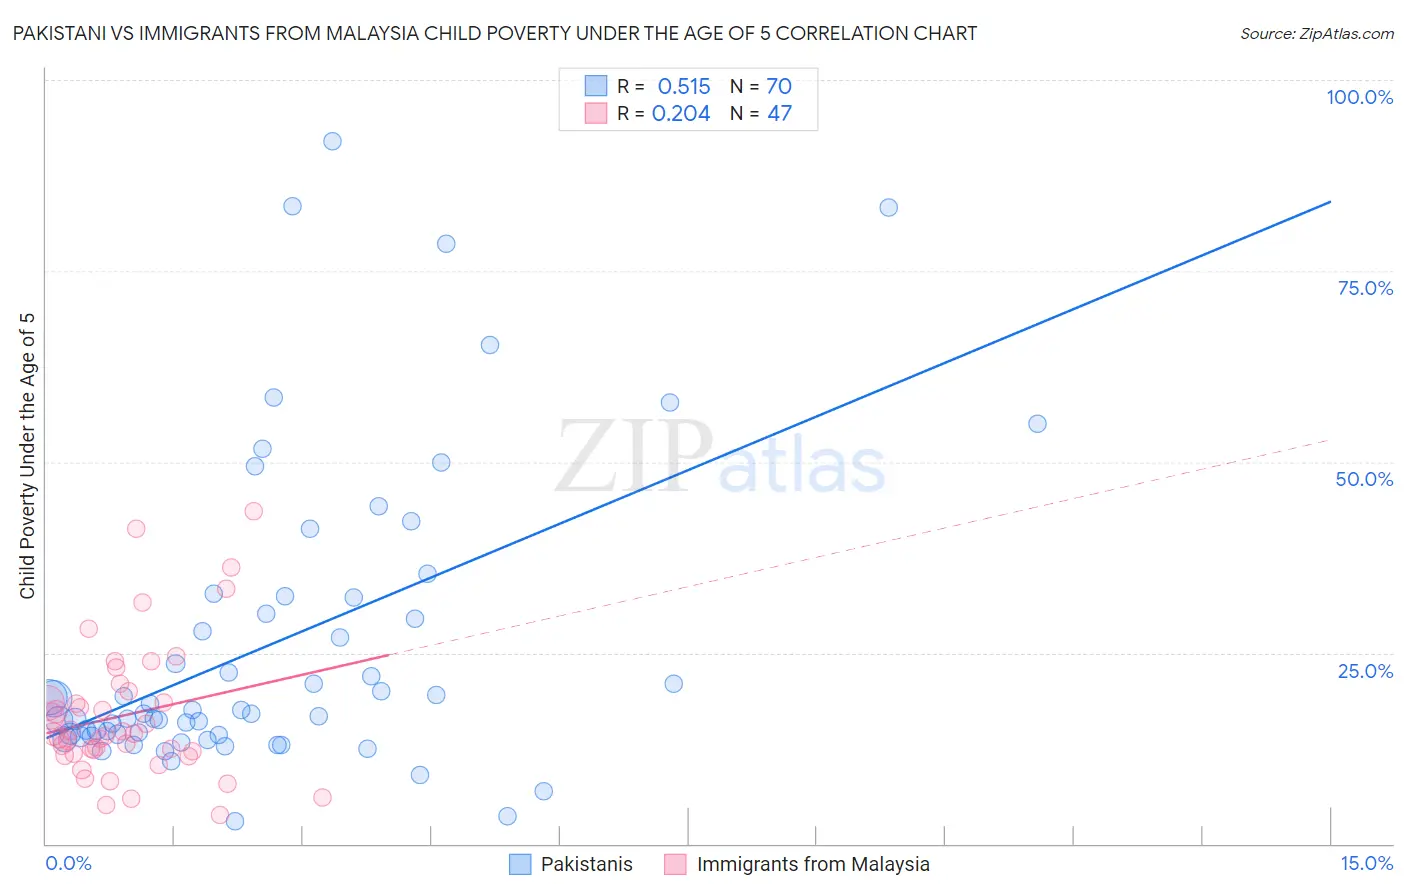
Pakistani vs Immigrants from Malaysia Child Poverty Under the Age of 5 Correlation Chart

The statistical analysis conducted on geographies consisting of 324,820,623 people shows a substantial positive correlation between the proportion of Pakistanis and poverty level among children under the age of 5 in the United States with a correlation coefficient (R) of 0.515 and weighted average of 16.0%. Similarly, the statistical analysis conducted on geographies consisting of 192,879,817 people shows a weak positive correlation between the proportion of Immigrants from Malaysia and poverty level among children under the age of 5 in the United States with a correlation coefficient (R) of 0.204 and weighted average of 15.6%, a difference of 2.5%.
Pakistani vs Immigrants from Malaysia Child Poverty Under the Age of 5

Child Poverty Under the Age of 5 Correlation Summary

MeasurementPakistaniImmigrants from Malaysia
Minimum3.0%3.7%
Maximum92.0%43.6%
Range89.0%39.8%
Mean26.2%16.9%
Median17.3%14.3%
Interquartile 25% (IQ1)14.3%11.8%
Interquartile 75% (IQ3)32.3%20.0%
Interquartile Range (IQR)18.0%8.2%
Standard Deviation (Sample)19.9%8.9%
Standard Deviation (Population)19.8%8.8%

Similar Demographics by Child Poverty Under the Age of 5

Demographics Similar to Pakistanis by Child Poverty Under the Age of 5

In terms of child poverty under the age of 5, the demographic groups most similar to Pakistanis are Northern European (16.0%, a difference of 0.040%), Romanian (16.0%, a difference of 0.040%), Peruvian (16.0%, a difference of 0.050%), Puget Sound Salish (16.0%, a difference of 0.060%), and Immigrants from Brazil (16.0%, a difference of 0.12%).
DemographicsRating | RankChild Poverty Under the Age of 5
Immigrants | North America
94.9
/100
|
#104
Exceptional
15.9%
Immigrants | Spain
94.8
/100
|
#105
Exceptional
15.9%
Tlingit-Haida
94.7
/100
|
#106
Exceptional
15.9%
Slovenes
94.4
/100
|
#107
Exceptional
16.0%
Immigrants | Brazil
94.4
/100
|
#108
Exceptional
16.0%
Northern Europeans
94.3
/100
|
#109
Exceptional
16.0%
Romanians
94.3
/100
|
#110
Exceptional
16.0%
Pakistanis
94.2
/100
|
#111
Exceptional
16.0%
Peruvians
94.1
/100
|
#112
Exceptional
16.0%
Puget Sound Salish
94.1
/100
|
#113
Exceptional
16.0%
Immigrants | Kuwait
93.9
/100
|
#114
Exceptional
16.0%
Albanians
93.8
/100
|
#115
Exceptional
16.0%
Immigrants | Austria
93.5
/100
|
#116
Exceptional
16.0%
Basques
93.4
/100
|
#117
Exceptional
16.0%
Immigrants | Denmark
93.4
/100
|
#118
Exceptional
16.0%

Demographics Similar to Immigrants from Malaysia by Child Poverty Under the Age of 5

In terms of child poverty under the age of 5, the demographic groups most similar to Immigrants from Malaysia are Immigrants from Latvia (15.6%, a difference of 0.0%), Immigrants from Vietnam (15.6%, a difference of 0.080%), Jordanian (15.6%, a difference of 0.13%), Immigrants from Netherlands (15.6%, a difference of 0.16%), and Chilean (15.6%, a difference of 0.18%).
DemographicsRating | RankChild Poverty Under the Age of 5
Australians
98.0
/100
|
#79
Exceptional
15.5%
Italians
97.9
/100
|
#80
Exceptional
15.5%
Czechs
97.8
/100
|
#81
Exceptional
15.5%
Immigrants | Italy
97.7
/100
|
#82
Exceptional
15.6%
Chileans
97.6
/100
|
#83
Exceptional
15.6%
Immigrants | Netherlands
97.6
/100
|
#84
Exceptional
15.6%
Immigrants | Latvia
97.4
/100
|
#85
Exceptional
15.6%
Immigrants | Malaysia
97.4
/100
|
#86
Exceptional
15.6%
Immigrants | Vietnam
97.4
/100
|
#87
Exceptional
15.6%
Jordanians
97.3
/100
|
#88
Exceptional
15.6%
Immigrants | Croatia
97.3
/100
|
#89
Exceptional
15.6%
Immigrants | France
97.3
/100
|
#90
Exceptional
15.6%
Poles
97.2
/100
|
#91
Exceptional
15.7%
Scandinavians
97.1
/100
|
#92
Exceptional
15.7%
Ukrainians
97.1
/100
|
#93
Exceptional
15.7%