Pakistani vs Immigrants from Afghanistan Male Poverty

COMPARE

Pakistani
Race
Ancestry
AfghanAfricanAlaska NativeAlaskan AthabascanAlbanianAleutAlsatianAmericanApacheArabArapahoArgentineanArmenianAssyrian/Chaldean/SyriacAustralianAustrianBahamianBangladeshiBarbadianBasqueBelgianBelizeanBermudanBhutaneseBlackfeetBolivianBrazilianBritishBritish West IndianBulgarianBurmeseCajunCambodianCanadianCape VerdeanCarpatho RusynCelticCentral AmericanCentral American IndianCherokeeCheyenneChickasawChileanChineseChippewaChoctawColombianColvilleComancheCosta RicanCreeCreekCroatianCrowCubanCypriotCzechCzechoslovakianDanishDelawareDominicanDutchDutch West IndianEastern EuropeanEcuadorianEgyptianEnglishEstonianEthiopianEuropeanFijianFilipinoFinnishFrenchFrench American IndianFrench CanadianGermanGerman RussianGhanaianGreekGuamanian/ChamorroGuatemalanGuyaneseHaitianHmongHonduranHopiHoumaHungarianIcelanderIndian (Asian)IndonesianInupiatIranianIraqiIrishIroquoisIsraeliItalianJamaicanJapaneseJordanianKenyanKiowaKoreanLaotianLatvianLebaneseLiberianLithuanianLumbeeLuxembourgerMacedonianMalaysianMalteseMarshalleseMenomineeMexicanMexican American IndianMongolianMoroccanNative HawaiianNavajoNepaleseNew ZealanderNicaraguanNigerianNorthern EuropeanNorwegianOkinawanOsageOttawaPaiutePakistaniPalestinianPanamanianParaguayanPennsylvania GermanPeruvianPimaPolishPortuguesePotawatomiPuebloPuerto RicanPuget Sound SalishRomanianRussianSalvadoranSamoanScandinavianScotch-IrishScottishSeminoleSenegaleseSerbianShoshoneSierra LeoneanSiouxSlavicSlovakSloveneSomaliSouth AfricanSouth AmericanSouth American IndianSoviet UnionSpaniardSpanishSpanish AmericanSpanish American IndianSri LankanSubsaharan AfricanSudaneseSwedishSwissSyrianTaiwaneseThaiTlingit-HaidaTohono O'OdhamTonganTrinidadian and TobagonianTsimshianTurkishU.S. Virgin IslanderUgandanUkrainianUruguayanUteVenezuelanVietnameseWelshWest IndianYakamaYaquiYugoslavianYumanYup'ikZimbabwean
Immigration
NonimmigrantsImmigrantsAfricaAlbaniaArgentinaArmeniaAsiaAustraliaAustriaBahamasBangladeshBarbadosBelarusBelgiumBelizeBoliviaBosnia and HerzegovinaBrazilBulgariaBurma/MyanmarCabo VerdeCambodiaCameroonCanadaCaribbeanCentral AmericaChileChinaColombiaCongoCosta RicaCroatiaCubaCzechoslovakiaDenmarkDominicaDominican RepublicEastern AfricaEastern AsiaEastern EuropeEcuadorEgyptEl SalvadorEnglandEritreaEthiopiaEuropeFijiFranceGermanyGhanaGreeceGrenadaGuatemalaGuyanaHaitiHondurasHong KongHungaryIndiaIndonesiaIranIraqIrelandIsraelItalyJamaicaJapanJordanKazakhstanKenyaKoreaKuwaitLaosLatin AmericaLatviaLebanonLiberiaLithuaniaMalaysiaMexicoMicronesiaMiddle AfricaMoldovaMoroccoNepalNetherlandsNicaraguaNigeriaNorth AmericaNorth MacedoniaNorthern AfricaNorthern EuropeNorwayOceaniaPakistanPanamaPeruPhilippinesPolandPortugalRomaniaRussiaSaudi ArabiaScotlandSenegalSerbiaSierra LeoneSingaporeSomaliaSouth AfricaSouth AmericaSouth Central AsiaSouth Eastern AsiaSouthern EuropeSpainSri LankaSt. Vincent and the GrenadinesSudanSwedenSwitzerlandSyriaTaiwanThailandTrinidad and TobagoTurkeyUgandaUkraineUruguayUzbekistanVenezuelaVietnamWest IndiesWestern AfricaWestern AsiaWestern EuropeYemenZaireZimbabweAzores
Immigrants from Afghanistan
Race
Ancestry
AfghanAfricanAlaska NativeAlaskan AthabascanAlbanianAleutAlsatianAmericanApacheArabArapahoArgentineanArmenianAssyrian/Chaldean/SyriacAustralianAustrianBahamianBangladeshiBarbadianBasqueBelgianBelizeanBermudanBhutaneseBlackfeetBolivianBrazilianBritishBritish West IndianBulgarianBurmeseCajunCambodianCanadianCape VerdeanCarpatho RusynCelticCentral AmericanCentral American IndianCherokeeCheyenneChickasawChileanChineseChippewaChoctawColombianColvilleComancheCosta RicanCreeCreekCroatianCrowCubanCypriotCzechCzechoslovakianDanishDelawareDominicanDutchDutch West IndianEastern EuropeanEcuadorianEgyptianEnglishEstonianEthiopianEuropeanFijianFilipinoFinnishFrenchFrench American IndianFrench CanadianGermanGerman RussianGhanaianGreekGuamanian/ChamorroGuatemalanGuyaneseHaitianHmongHonduranHopiHoumaHungarianIcelanderIndian (Asian)IndonesianInupiatIranianIraqiIrishIroquoisIsraeliItalianJamaicanJapaneseJordanianKenyanKiowaKoreanLaotianLatvianLebaneseLiberianLithuanianLumbeeLuxembourgerMacedonianMalaysianMalteseMarshalleseMenomineeMexicanMexican American IndianMongolianMoroccanNative HawaiianNavajoNepaleseNew ZealanderNicaraguanNigerianNorthern EuropeanNorwegianOkinawanOsageOttawaPaiutePalestinianPanamanianParaguayanPennsylvania GermanPeruvianPimaPolishPortuguesePotawatomiPuebloPuerto RicanPuget Sound SalishRomanianRussianSalvadoranSamoanScandinavianScotch-IrishScottishSeminoleSenegaleseSerbianShoshoneSierra LeoneanSiouxSlavicSlovakSloveneSomaliSouth AfricanSouth AmericanSouth American IndianSoviet UnionSpaniardSpanishSpanish AmericanSpanish American IndianSri LankanSubsaharan AfricanSudaneseSwedishSwissSyrianTaiwaneseThaiTlingit-HaidaTohono O'OdhamTonganTrinidadian and TobagonianTsimshianTurkishU.S. Virgin IslanderUgandanUkrainianUruguayanUteVenezuelanVietnameseWelshWest IndianYakamaYaquiYugoslavianYumanYup'ikZimbabwean
Immigration
NonimmigrantsImmigrantsAfghanistanAfricaAlbaniaArgentinaArmeniaAsiaAustraliaAustriaBahamasBangladeshBarbadosBelarusBelgiumBelizeBoliviaBosnia and HerzegovinaBrazilBulgariaBurma/MyanmarCabo VerdeCambodiaCameroonCanadaCaribbeanCentral AmericaChileChinaColombiaCongoCosta RicaCroatiaCubaCzechoslovakiaDenmarkDominicaDominican RepublicEastern AfricaEastern AsiaEastern EuropeEcuadorEgyptEl SalvadorEnglandEritreaEthiopiaEuropeFijiFranceGermanyGhanaGreeceGrenadaGuatemalaGuyanaHaitiHondurasHong KongHungaryIndiaIndonesiaIranIraqIrelandIsraelItalyJamaicaJapanJordanKazakhstanKenyaKoreaKuwaitLaosLatin AmericaLatviaLebanonLiberiaLithuaniaMalaysiaMexicoMicronesiaMiddle AfricaMoldovaMoroccoNepalNetherlandsNicaraguaNigeriaNorth AmericaNorth MacedoniaNorthern AfricaNorthern EuropeNorwayOceaniaPakistanPanamaPeruPhilippinesPolandPortugalRomaniaRussiaSaudi ArabiaScotlandSenegalSerbiaSierra LeoneSingaporeSomaliaSouth AfricaSouth AmericaSouth Central AsiaSouth Eastern AsiaSouthern EuropeSpainSri LankaSt. Vincent and the GrenadinesSudanSwedenSwitzerlandSyriaTaiwanThailandTrinidad and TobagoTurkeyUgandaUkraineUruguayUzbekistanVenezuelaVietnamWest IndiesWestern AfricaWestern AsiaWestern EuropeYemenZaireZimbabweAzores
Male Poverty
Income
Poverty
Unemployment
Labor Participation
Family Structure
Vehicle Availability
Education Level
Disability

Male Poverty Comparison

Pakistanis

Immigrants from Afghanistan

Excellent
Fair
10.8%
MALE POVERTY
83.0/ 100
METRIC RATING
133rd/ 347
METRIC RANK
11.4%
MALE POVERTY
33.3/ 100
METRIC RATING
185th/ 347
METRIC RANK

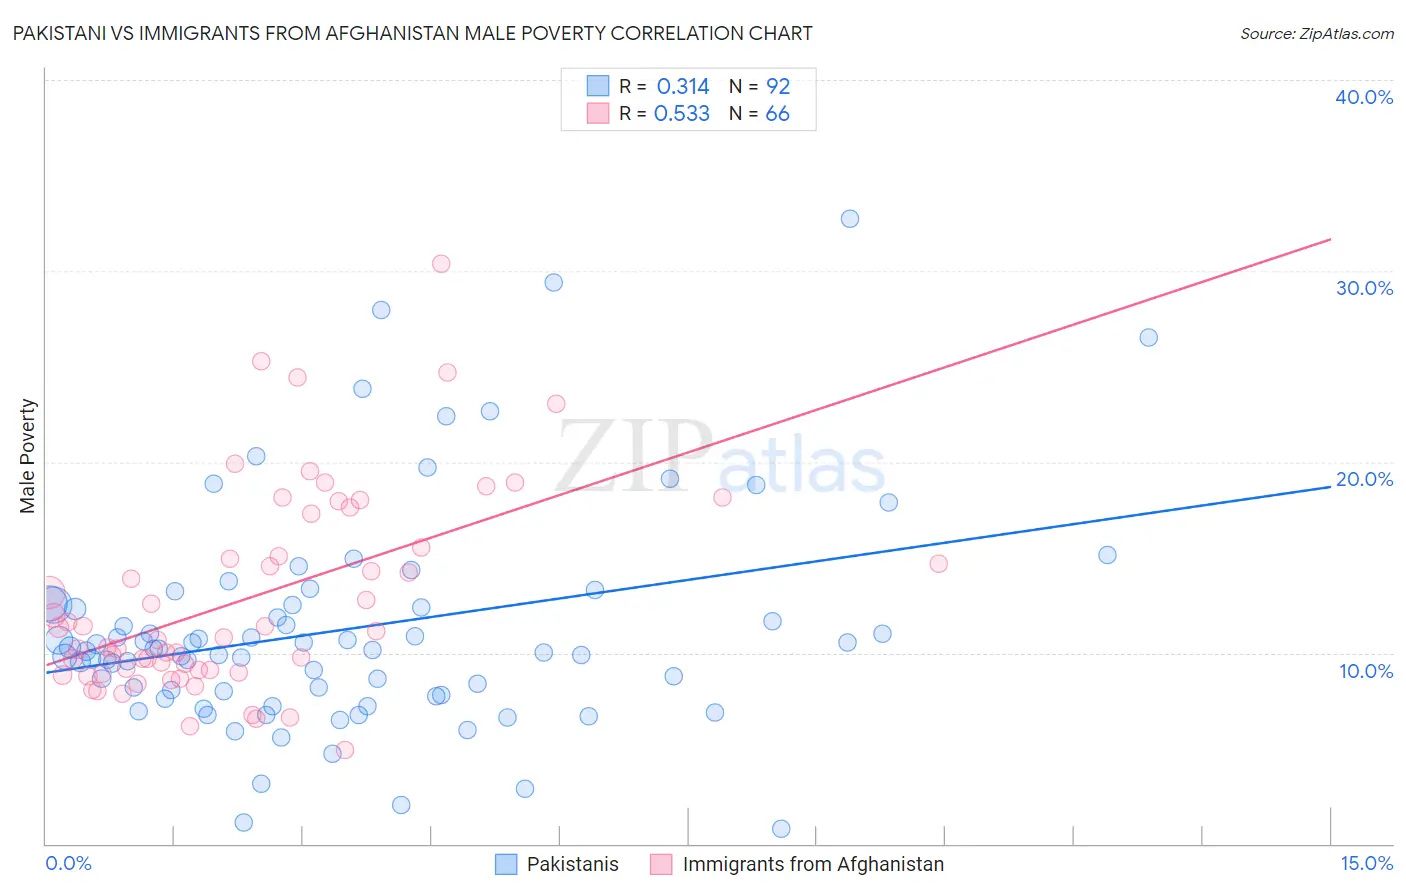
Pakistani vs Immigrants from Afghanistan Male Poverty Correlation Chart

The statistical analysis conducted on geographies consisting of 335,136,890 people shows a mild positive correlation between the proportion of Pakistanis and poverty level among males in the United States with a correlation coefficient (R) of 0.314 and weighted average of 10.8%. Similarly, the statistical analysis conducted on geographies consisting of 147,624,521 people shows a substantial positive correlation between the proportion of Immigrants from Afghanistan and poverty level among males in the United States with a correlation coefficient (R) of 0.533 and weighted average of 11.4%, a difference of 5.8%.
Pakistani vs Immigrants from Afghanistan Male Poverty

Male Poverty Correlation Summary

MeasurementPakistaniImmigrants from Afghanistan
Minimum0.75%4.9%
Maximum32.7%30.4%
Range32.0%25.5%
Mean11.2%12.8%
Median10.2%11.0%
Interquartile 25% (IQ1)7.9%9.1%
Interquartile 75% (IQ3)12.5%15.5%
Interquartile Range (IQR)4.6%6.4%
Standard Deviation (Sample)5.8%5.3%
Standard Deviation (Population)5.8%5.3%

Similar Demographics by Male Poverty

Demographics Similar to Pakistanis by Male Poverty

In terms of male poverty, the demographic groups most similar to Pakistanis are Immigrants from Vietnam (10.8%, a difference of 0.010%), New Zealander (10.8%, a difference of 0.010%), Brazilian (10.8%, a difference of 0.050%), Immigrants from Belarus (10.7%, a difference of 0.060%), and Chilean (10.7%, a difference of 0.17%).
DemographicsRating | RankMale Poverty
Immigrants | Ukraine
84.3
/100
|
#126
Excellent
10.7%
Puget Sound Salish
84.3
/100
|
#127
Excellent
10.7%
Immigrants | Western Europe
84.2
/100
|
#128
Excellent
10.7%
Immigrants | Peru
84.1
/100
|
#129
Excellent
10.7%
Chileans
83.9
/100
|
#130
Excellent
10.7%
Immigrants | Belarus
83.3
/100
|
#131
Excellent
10.7%
Immigrants | Vietnam
83.0
/100
|
#132
Excellent
10.8%
Pakistanis
83.0
/100
|
#133
Excellent
10.8%
New Zealanders
82.9
/100
|
#134
Excellent
10.8%
Brazilians
82.7
/100
|
#135
Excellent
10.8%
Immigrants | Israel
80.9
/100
|
#136
Excellent
10.8%
Immigrants | Switzerland
79.2
/100
|
#137
Good
10.8%
Yugoslavians
78.2
/100
|
#138
Good
10.8%
Immigrants | Jordan
77.5
/100
|
#139
Good
10.8%
Tlingit-Haida
76.1
/100
|
#140
Good
10.9%

Demographics Similar to Immigrants from Afghanistan by Male Poverty

In terms of male poverty, the demographic groups most similar to Immigrants from Afghanistan are Immigrants from Sierra Leone (11.4%, a difference of 0.050%), Immigrants from Iraq (11.4%, a difference of 0.16%), Immigrants from South America (11.3%, a difference of 0.38%), Sierra Leonean (11.4%, a difference of 0.38%), and Kenyan (11.3%, a difference of 0.54%).
DemographicsRating | RankMale Poverty
Immigrants | Cameroon
44.5
/100
|
#178
Average
11.2%
Immigrants | Syria
40.3
/100
|
#179
Average
11.3%
Immigrants | Morocco
40.1
/100
|
#180
Average
11.3%
Immigrants | Costa Rica
39.5
/100
|
#181
Fair
11.3%
Mongolians
39.0
/100
|
#182
Fair
11.3%
Kenyans
38.4
/100
|
#183
Fair
11.3%
Immigrants | South America
36.9
/100
|
#184
Fair
11.3%
Immigrants | Afghanistan
33.3
/100
|
#185
Fair
11.4%
Immigrants | Sierra Leone
32.9
/100
|
#186
Fair
11.4%
Immigrants | Iraq
31.9
/100
|
#187
Fair
11.4%
Sierra Leoneans
29.9
/100
|
#188
Fair
11.4%
Hawaiians
28.3
/100
|
#189
Fair
11.4%
Israelis
26.1
/100
|
#190
Fair
11.5%
South American Indians
22.8
/100
|
#191
Fair
11.5%
Immigrants | Uruguay
19.1
/100
|
#192
Poor
11.6%