Osage vs Immigrants from Syria Seniors Poverty Over the Age of 75
COMPARE
Osage
Immigrants from Syria
Seniors Poverty Over the Age of 75
Seniors Poverty Over the Age of 75 Comparison
Osage
Immigrants from Syria
11.4%
SENIORS POVERTY OVER THE AGE OF 75
96.3/ 100
METRIC RATING
71st/ 347
METRIC RANK
12.2%
SENIORS POVERTY OVER THE AGE OF 75
53.9/ 100
METRIC RATING
168th/ 347
METRIC RANK
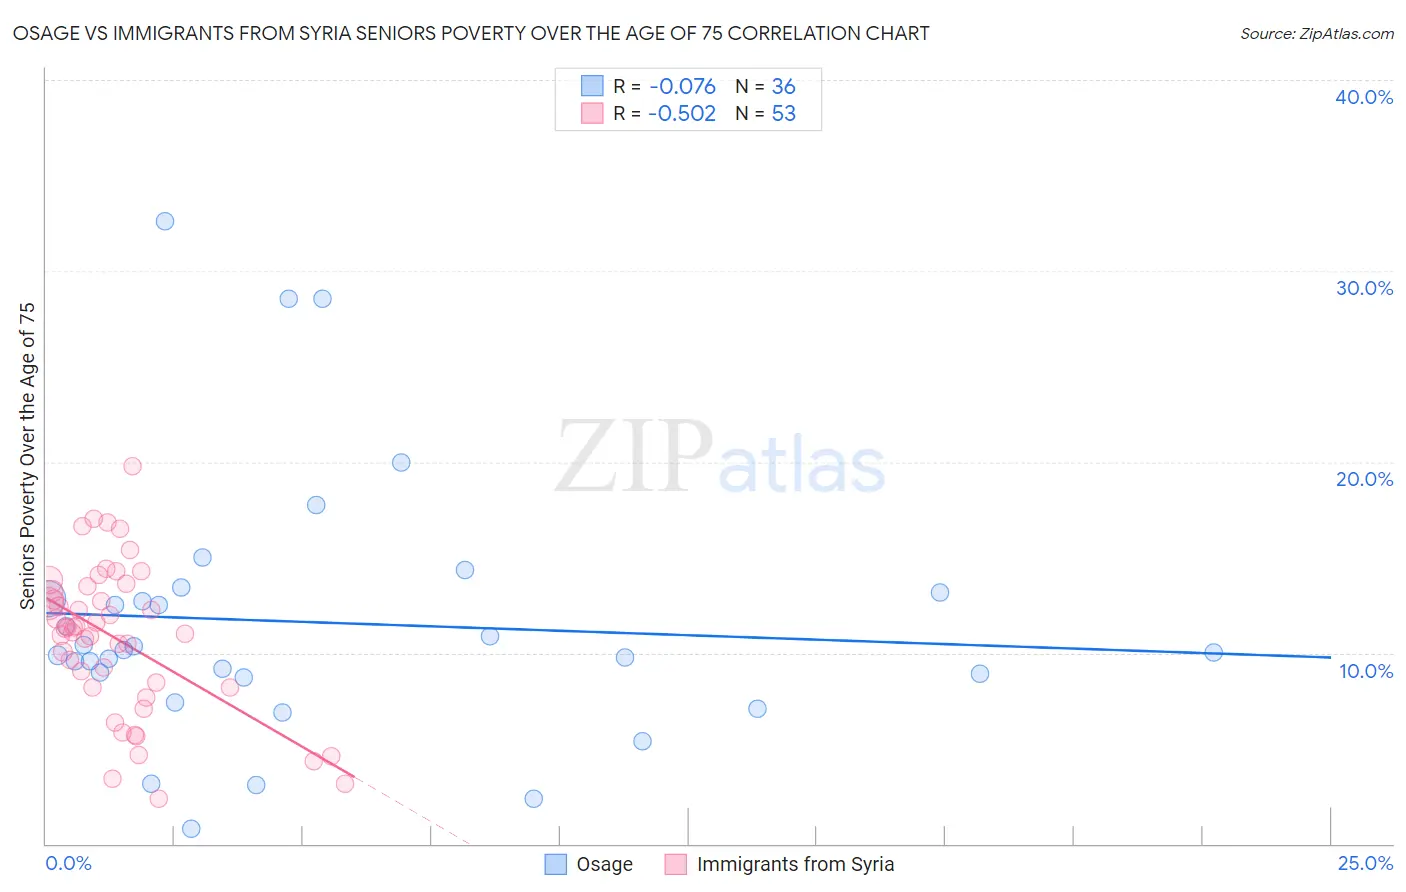
Osage vs Immigrants from Syria Seniors Poverty Over the Age of 75 Correlation Chart
The statistical analysis conducted on geographies consisting of 91,517,033 people shows a slight negative correlation between the proportion of Osage and poverty level among seniors over the age of 75 in the United States with a correlation coefficient (R) of -0.076 and weighted average of 11.4%. Similarly, the statistical analysis conducted on geographies consisting of 173,460,878 people shows a substantial negative correlation between the proportion of Immigrants from Syria and poverty level among seniors over the age of 75 in the United States with a correlation coefficient (R) of -0.502 and weighted average of 12.2%, a difference of 6.8%.
Seniors Poverty Over the Age of 75 Correlation Summary
| Measurement | Osage | Immigrants from Syria |
| Minimum | 0.78% | 2.4% |
| Maximum | 32.6% | 19.7% |
| Range | 31.8% | 17.4% |
| Mean | 11.6% | 10.7% |
| Median | 10.1% | 11.3% |
| Interquartile 25% (IQ1) | 8.8% | 8.2% |
| Interquartile 75% (IQ3) | 13.0% | 13.4% |
| Interquartile Range (IQR) | 4.2% | 5.2% |
| Standard Deviation (Sample) | 6.9% | 3.9% |
| Standard Deviation (Population) | 6.8% | 3.9% |
Similar Demographics by Seniors Poverty Over the Age of 75
Demographics Similar to Osage by Seniors Poverty Over the Age of 75
In terms of seniors poverty over the age of 75, the demographic groups most similar to Osage are Immigrants from South Central Asia (11.4%, a difference of 0.080%), Sierra Leonean (11.4%, a difference of 0.10%), Ottawa (11.4%, a difference of 0.11%), Immigrants from Austria (11.4%, a difference of 0.12%), and Bolivian (11.4%, a difference of 0.15%).
| Demographics | Rating | Rank | Seniors Poverty Over the Age of 75 |
| Immigrants | Northern Europe | 97.4 /100 | #64 | Exceptional 11.3% |
| Immigrants | Taiwan | 96.7 /100 | #65 | Exceptional 11.4% |
| Estonians | 96.7 /100 | #66 | Exceptional 11.4% |
| Bolivians | 96.5 /100 | #67 | Exceptional 11.4% |
| Immigrants | Austria | 96.5 /100 | #68 | Exceptional 11.4% |
| Ottawa | 96.5 /100 | #69 | Exceptional 11.4% |
| Immigrants | South Central Asia | 96.4 /100 | #70 | Exceptional 11.4% |
| Osage | 96.3 /100 | #71 | Exceptional 11.4% |
| Sierra Leoneans | 96.1 /100 | #72 | Exceptional 11.4% |
| Immigrants | Micronesia | 96.0 /100 | #73 | Exceptional 11.4% |
| Delaware | 96.0 /100 | #74 | Exceptional 11.4% |
| Palestinians | 95.8 /100 | #75 | Exceptional 11.4% |
| French Canadians | 95.7 /100 | #76 | Exceptional 11.4% |
| Whites/Caucasians | 95.5 /100 | #77 | Exceptional 11.4% |
| Macedonians | 95.5 /100 | #78 | Exceptional 11.4% |
Demographics Similar to Immigrants from Syria by Seniors Poverty Over the Age of 75
In terms of seniors poverty over the age of 75, the demographic groups most similar to Immigrants from Syria are Immigrants from Egypt (12.2%, a difference of 0.010%), Immigrants from Switzerland (12.1%, a difference of 0.050%), Egyptian (12.1%, a difference of 0.080%), Immigrants from Thailand (12.2%, a difference of 0.15%), and Spaniard (12.2%, a difference of 0.19%).
| Demographics | Rating | Rank | Seniors Poverty Over the Age of 75 |
| Immigrants | Norway | 60.6 /100 | #161 | Good 12.1% |
| Immigrants | Serbia | 60.2 /100 | #162 | Good 12.1% |
| Immigrants | Greece | 58.2 /100 | #163 | Average 12.1% |
| Potawatomi | 57.4 /100 | #164 | Average 12.1% |
| Okinawans | 56.3 /100 | #165 | Average 12.1% |
| Egyptians | 54.8 /100 | #166 | Average 12.1% |
| Immigrants | Switzerland | 54.5 /100 | #167 | Average 12.1% |
| Immigrants | Syria | 53.9 /100 | #168 | Average 12.2% |
| Immigrants | Egypt | 53.7 /100 | #169 | Average 12.2% |
| Immigrants | Thailand | 52.0 /100 | #170 | Average 12.2% |
| Spaniards | 51.6 /100 | #171 | Average 12.2% |
| Immigrants | Fiji | 51.5 /100 | #172 | Average 12.2% |
| Arabs | 50.5 /100 | #173 | Average 12.2% |
| Immigrants | Europe | 50.0 /100 | #174 | Average 12.2% |
| Immigrants | Saudi Arabia | 49.5 /100 | #175 | Average 12.2% |