Osage vs Houma Seniors Poverty Over the Age of 75
COMPARE
Osage
Houma
Seniors Poverty Over the Age of 75
Seniors Poverty Over the Age of 75 Comparison
Osage
Houma
11.4%
SENIORS POVERTY OVER THE AGE OF 75
96.3/ 100
METRIC RATING
71st/ 347
METRIC RANK
16.2%
SENIORS POVERTY OVER THE AGE OF 75
0.0/ 100
METRIC RATING
318th/ 347
METRIC RANK
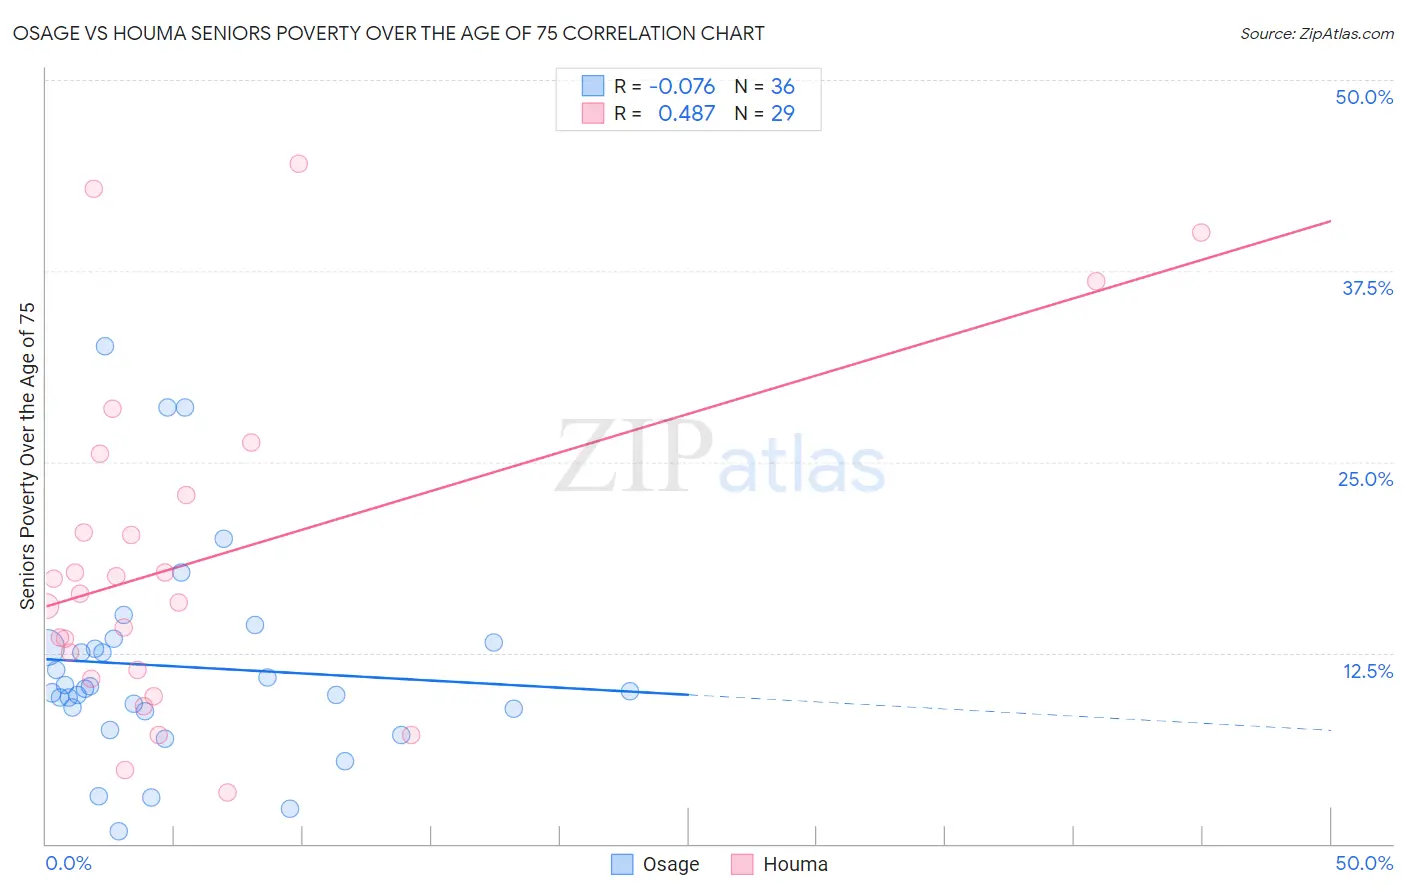
Osage vs Houma Seniors Poverty Over the Age of 75 Correlation Chart
The statistical analysis conducted on geographies consisting of 91,517,033 people shows a slight negative correlation between the proportion of Osage and poverty level among seniors over the age of 75 in the United States with a correlation coefficient (R) of -0.076 and weighted average of 11.4%. Similarly, the statistical analysis conducted on geographies consisting of 36,627,253 people shows a moderate positive correlation between the proportion of Houma and poverty level among seniors over the age of 75 in the United States with a correlation coefficient (R) of 0.487 and weighted average of 16.2%, a difference of 42.7%.
Seniors Poverty Over the Age of 75 Correlation Summary
| Measurement | Osage | Houma |
| Minimum | 0.78% | 3.3% |
| Maximum | 32.6% | 44.5% |
| Range | 31.8% | 41.2% |
| Mean | 11.6% | 18.7% |
| Median | 10.1% | 16.4% |
| Interquartile 25% (IQ1) | 8.8% | 11.1% |
| Interquartile 75% (IQ3) | 13.0% | 24.2% |
| Interquartile Range (IQR) | 4.2% | 13.1% |
| Standard Deviation (Sample) | 6.9% | 11.0% |
| Standard Deviation (Population) | 6.8% | 10.8% |
Similar Demographics by Seniors Poverty Over the Age of 75
Demographics Similar to Osage by Seniors Poverty Over the Age of 75
In terms of seniors poverty over the age of 75, the demographic groups most similar to Osage are Immigrants from South Central Asia (11.4%, a difference of 0.080%), Sierra Leonean (11.4%, a difference of 0.10%), Ottawa (11.4%, a difference of 0.11%), Immigrants from Austria (11.4%, a difference of 0.12%), and Bolivian (11.4%, a difference of 0.15%).
| Demographics | Rating | Rank | Seniors Poverty Over the Age of 75 |
| Immigrants | Northern Europe | 97.4 /100 | #64 | Exceptional 11.3% |
| Immigrants | Taiwan | 96.7 /100 | #65 | Exceptional 11.4% |
| Estonians | 96.7 /100 | #66 | Exceptional 11.4% |
| Bolivians | 96.5 /100 | #67 | Exceptional 11.4% |
| Immigrants | Austria | 96.5 /100 | #68 | Exceptional 11.4% |
| Ottawa | 96.5 /100 | #69 | Exceptional 11.4% |
| Immigrants | South Central Asia | 96.4 /100 | #70 | Exceptional 11.4% |
| Osage | 96.3 /100 | #71 | Exceptional 11.4% |
| Sierra Leoneans | 96.1 /100 | #72 | Exceptional 11.4% |
| Immigrants | Micronesia | 96.0 /100 | #73 | Exceptional 11.4% |
| Delaware | 96.0 /100 | #74 | Exceptional 11.4% |
| Palestinians | 95.8 /100 | #75 | Exceptional 11.4% |
| French Canadians | 95.7 /100 | #76 | Exceptional 11.4% |
| Whites/Caucasians | 95.5 /100 | #77 | Exceptional 11.4% |
| Macedonians | 95.5 /100 | #78 | Exceptional 11.4% |
Demographics Similar to Houma by Seniors Poverty Over the Age of 75
In terms of seniors poverty over the age of 75, the demographic groups most similar to Houma are Haitian (16.2%, a difference of 0.040%), Immigrants from Guyana (16.2%, a difference of 0.13%), Immigrants from Ecuador (16.1%, a difference of 0.74%), Guyanese (16.1%, a difference of 0.75%), and Tsimshian (16.1%, a difference of 1.1%).
| Demographics | Rating | Rank | Seniors Poverty Over the Age of 75 |
| Trinidadians and Tobagonians | 0.0 /100 | #311 | Tragic 15.9% |
| Crow | 0.0 /100 | #312 | Tragic 15.9% |
| Barbadians | 0.0 /100 | #313 | Tragic 16.0% |
| Tsimshian | 0.0 /100 | #314 | Tragic 16.1% |
| Guyanese | 0.0 /100 | #315 | Tragic 16.1% |
| Immigrants | Ecuador | 0.0 /100 | #316 | Tragic 16.1% |
| Immigrants | Guyana | 0.0 /100 | #317 | Tragic 16.2% |
| Houma | 0.0 /100 | #318 | Tragic 16.2% |
| Haitians | 0.0 /100 | #319 | Tragic 16.2% |
| Immigrants | Yemen | 0.0 /100 | #320 | Tragic 16.5% |
| Immigrants | Haiti | 0.0 /100 | #321 | Tragic 16.5% |
| Immigrants | Barbados | 0.0 /100 | #322 | Tragic 16.5% |
| Central American Indians | 0.0 /100 | #323 | Tragic 16.5% |
| Immigrants | Uzbekistan | 0.0 /100 | #324 | Tragic 16.5% |
| Nicaraguans | 0.0 /100 | #325 | Tragic 16.6% |