Okinawan vs Argentinean Child Poverty Under the Age of 5
COMPARE
Okinawan
Argentinean
Child Poverty Under the Age of 5
Child Poverty Under the Age of 5 Comparison
Okinawans
Argentineans
13.4%
CHILD POVERTY UNDER THE AGE OF 5
100.0/ 100
METRIC RATING
14th/ 347
METRIC RANK
15.4%
CHILD POVERTY UNDER THE AGE OF 5
98.5/ 100
METRIC RATING
74th/ 347
METRIC RANK
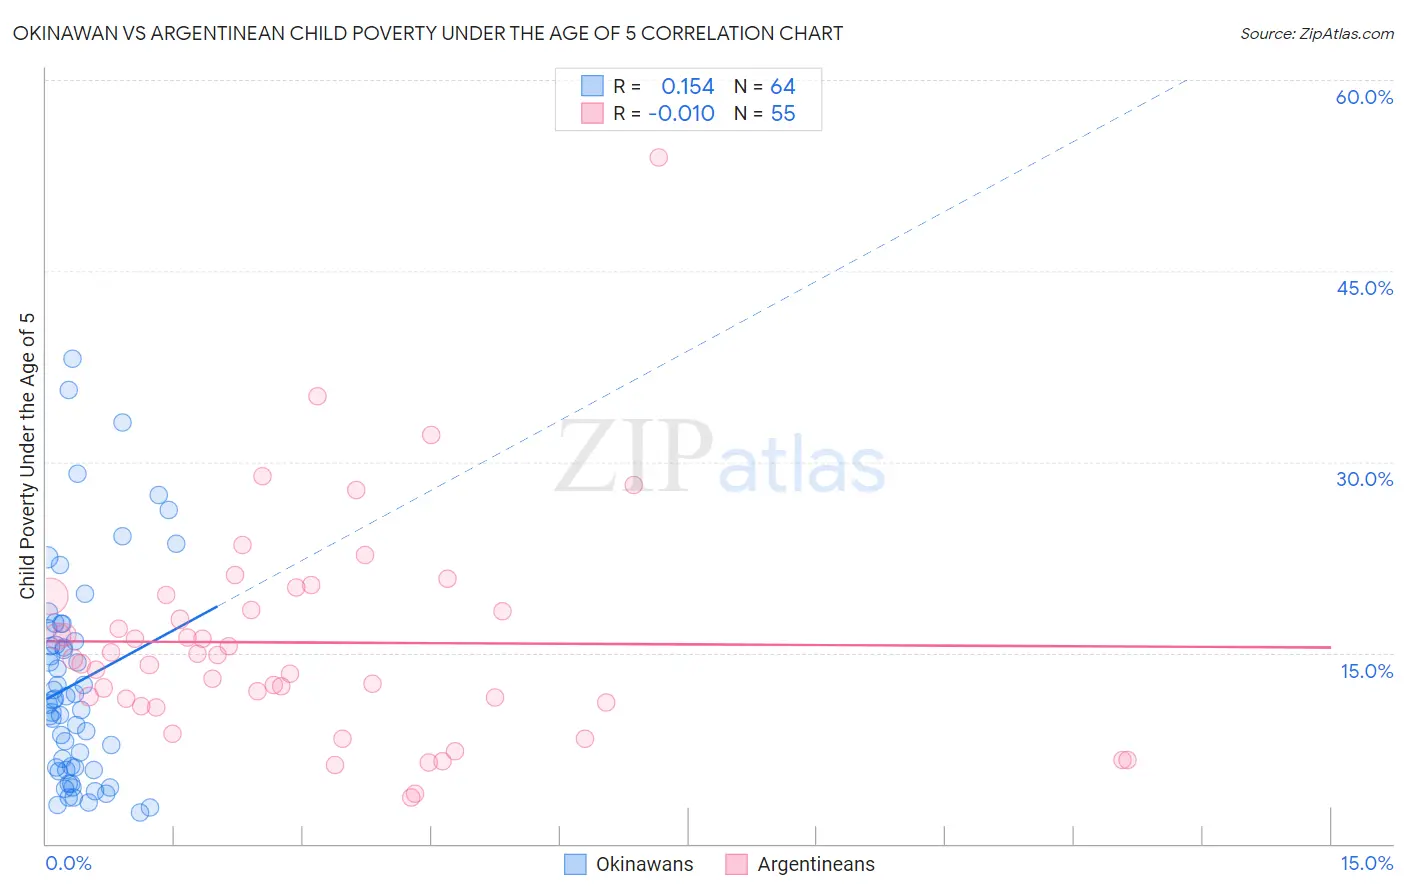
Okinawan vs Argentinean Child Poverty Under the Age of 5 Correlation Chart
The statistical analysis conducted on geographies consisting of 72,437,494 people shows a poor positive correlation between the proportion of Okinawans and poverty level among children under the age of 5 in the United States with a correlation coefficient (R) of 0.154 and weighted average of 13.4%. Similarly, the statistical analysis conducted on geographies consisting of 287,138,695 people shows no correlation between the proportion of Argentineans and poverty level among children under the age of 5 in the United States with a correlation coefficient (R) of -0.010 and weighted average of 15.4%, a difference of 14.2%.
Child Poverty Under the Age of 5 Correlation Summary
| Measurement | Okinawan | Argentinean |
| Minimum | 2.5% | 3.6% |
| Maximum | 38.1% | 53.9% |
| Range | 35.6% | 50.2% |
| Mean | 12.6% | 15.8% |
| Median | 11.1% | 14.5% |
| Interquartile 25% (IQ1) | 5.9% | 11.1% |
| Interquartile 75% (IQ3) | 16.4% | 19.5% |
| Interquartile Range (IQR) | 10.5% | 8.4% |
| Standard Deviation (Sample) | 8.4% | 8.6% |
| Standard Deviation (Population) | 8.3% | 8.5% |
Similar Demographics by Child Poverty Under the Age of 5
Demographics Similar to Okinawans by Child Poverty Under the Age of 5
In terms of child poverty under the age of 5, the demographic groups most similar to Okinawans are Indian (Asian) (13.4%, a difference of 0.050%), Immigrants from Eastern Asia (13.5%, a difference of 0.57%), Bhutanese (13.4%, a difference of 0.65%), Assyrian/Chaldean/Syriac (13.6%, a difference of 0.91%), and Immigrants from China (13.6%, a difference of 1.2%).
| Demographics | Rating | Rank | Child Poverty Under the Age of 5 |
| Chinese | 100.0 /100 | #7 | Exceptional 13.1% |
| Iranians | 100.0 /100 | #8 | Exceptional 13.1% |
| Immigrants | Iran | 100.0 /100 | #9 | Exceptional 13.1% |
| Burmese | 100.0 /100 | #10 | Exceptional 13.2% |
| Immigrants | Korea | 100.0 /100 | #11 | Exceptional 13.2% |
| Immigrants | South Central Asia | 100.0 /100 | #12 | Exceptional 13.3% |
| Bhutanese | 100.0 /100 | #13 | Exceptional 13.4% |
| Okinawans | 100.0 /100 | #14 | Exceptional 13.4% |
| Indians (Asian) | 100.0 /100 | #15 | Exceptional 13.4% |
| Immigrants | Eastern Asia | 100.0 /100 | #16 | Exceptional 13.5% |
| Assyrians/Chaldeans/Syriacs | 100.0 /100 | #17 | Exceptional 13.6% |
| Immigrants | China | 100.0 /100 | #18 | Exceptional 13.6% |
| Immigrants | Ireland | 100.0 /100 | #19 | Exceptional 13.7% |
| Immigrants | Japan | 100.0 /100 | #20 | Exceptional 13.8% |
| Bolivians | 100.0 /100 | #21 | Exceptional 13.8% |
Demographics Similar to Argentineans by Child Poverty Under the Age of 5
In terms of child poverty under the age of 5, the demographic groups most similar to Argentineans are Immigrants from Argentina (15.4%, a difference of 0.15%), Croatian (15.4%, a difference of 0.15%), Immigrants from Ukraine (15.3%, a difference of 0.36%), Immigrants from Turkey (15.4%, a difference of 0.36%), and Immigrants from Sweden (15.3%, a difference of 0.59%).
| Demographics | Rating | Rank | Child Poverty Under the Age of 5 |
| Greeks | 99.0 /100 | #67 | Exceptional 15.2% |
| Zimbabweans | 99.0 /100 | #68 | Exceptional 15.2% |
| Lithuanians | 99.0 /100 | #69 | Exceptional 15.2% |
| Immigrants | Belgium | 98.8 /100 | #70 | Exceptional 15.3% |
| Immigrants | Egypt | 98.8 /100 | #71 | Exceptional 15.3% |
| Immigrants | Sweden | 98.8 /100 | #72 | Exceptional 15.3% |
| Immigrants | Ukraine | 98.7 /100 | #73 | Exceptional 15.3% |
| Argentineans | 98.5 /100 | #74 | Exceptional 15.4% |
| Immigrants | Argentina | 98.5 /100 | #75 | Exceptional 15.4% |
| Croatians | 98.5 /100 | #76 | Exceptional 15.4% |
| Immigrants | Turkey | 98.3 /100 | #77 | Exceptional 15.4% |
| Sri Lankans | 98.1 /100 | #78 | Exceptional 15.5% |
| Australians | 98.0 /100 | #79 | Exceptional 15.5% |
| Italians | 97.9 /100 | #80 | Exceptional 15.5% |
| Czechs | 97.8 /100 | #81 | Exceptional 15.5% |