Immigrants from Armenia vs Argentinean Child Poverty Under the Age of 5
COMPARE
Immigrants from Armenia
Argentinean
Child Poverty Under the Age of 5
Child Poverty Under the Age of 5 Comparison
Immigrants from Armenia
Argentineans
17.5%
CHILD POVERTY UNDER THE AGE OF 5
38.0/ 100
METRIC RATING
185th/ 347
METRIC RANK
15.4%
CHILD POVERTY UNDER THE AGE OF 5
98.5/ 100
METRIC RATING
74th/ 347
METRIC RANK
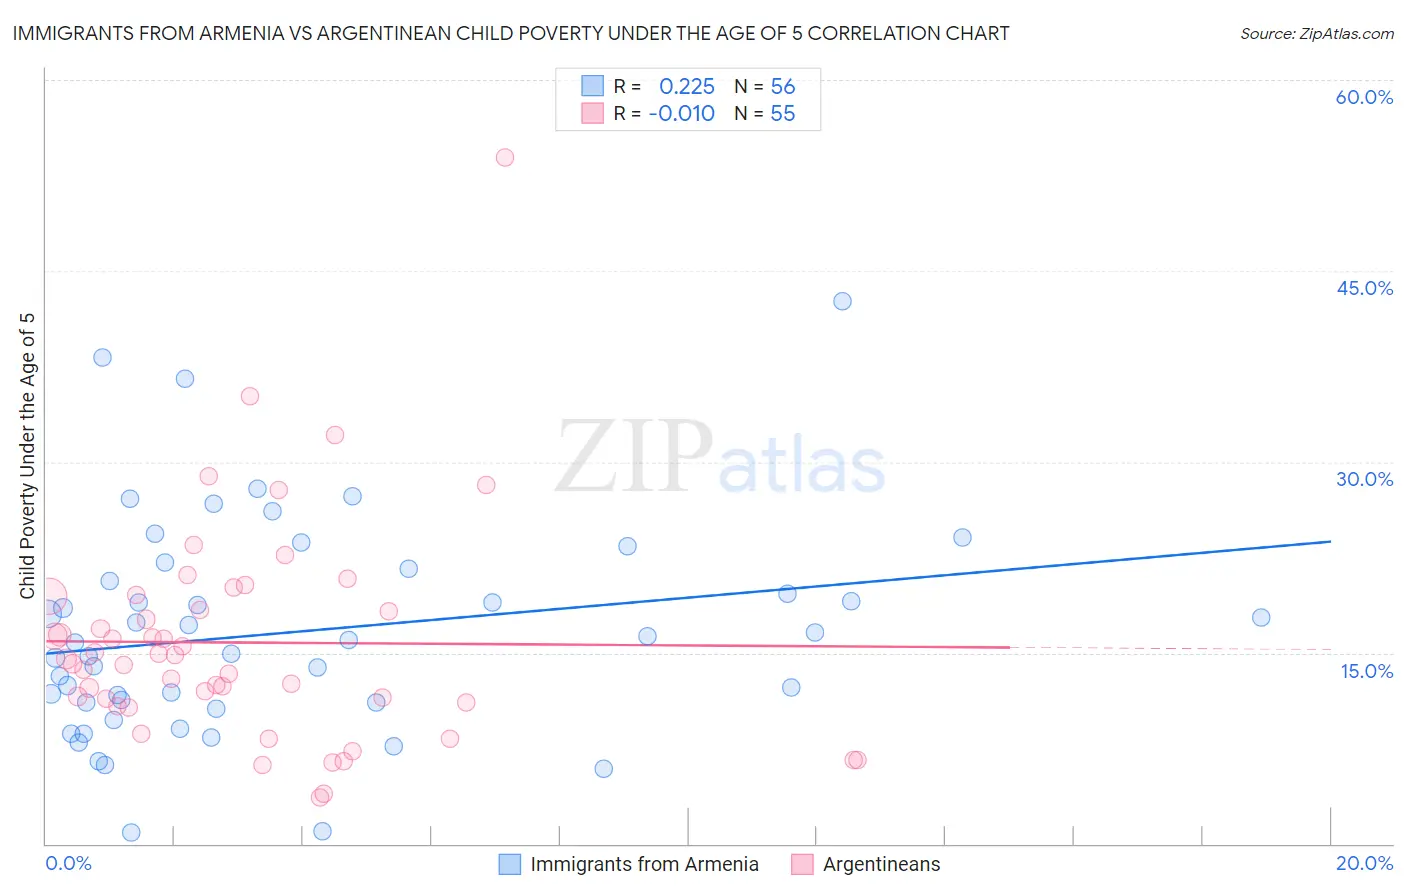
Immigrants from Armenia vs Argentinean Child Poverty Under the Age of 5 Correlation Chart
The statistical analysis conducted on geographies consisting of 95,794,423 people shows a weak positive correlation between the proportion of Immigrants from Armenia and poverty level among children under the age of 5 in the United States with a correlation coefficient (R) of 0.225 and weighted average of 17.5%. Similarly, the statistical analysis conducted on geographies consisting of 287,138,695 people shows no correlation between the proportion of Argentineans and poverty level among children under the age of 5 in the United States with a correlation coefficient (R) of -0.010 and weighted average of 15.4%, a difference of 13.7%.
Child Poverty Under the Age of 5 Correlation Summary
| Measurement | Immigrants from Armenia | Argentinean |
| Minimum | 0.86% | 3.6% |
| Maximum | 42.6% | 53.9% |
| Range | 41.7% | 50.2% |
| Mean | 16.6% | 15.8% |
| Median | 15.9% | 14.5% |
| Interquartile 25% (IQ1) | 11.1% | 11.1% |
| Interquartile 75% (IQ3) | 21.1% | 19.5% |
| Interquartile Range (IQR) | 10.0% | 8.4% |
| Standard Deviation (Sample) | 8.5% | 8.6% |
| Standard Deviation (Population) | 8.4% | 8.5% |
Similar Demographics by Child Poverty Under the Age of 5
Demographics Similar to Immigrants from Armenia by Child Poverty Under the Age of 5
In terms of child poverty under the age of 5, the demographic groups most similar to Immigrants from Armenia are Immigrants from Costa Rica (17.4%, a difference of 0.11%), Lebanese (17.4%, a difference of 0.25%), Arab (17.4%, a difference of 0.29%), Immigrants from Germany (17.4%, a difference of 0.32%), and Immigrants from Bosnia and Herzegovina (17.5%, a difference of 0.33%).
| Demographics | Rating | Rank | Child Poverty Under the Age of 5 |
| Immigrants | Cameroon | 42.7 /100 | #178 | Average 17.4% |
| Hawaiians | 41.5 /100 | #179 | Average 17.4% |
| South American Indians | 41.4 /100 | #180 | Average 17.4% |
| Immigrants | Germany | 41.0 /100 | #181 | Average 17.4% |
| Arabs | 40.7 /100 | #182 | Average 17.4% |
| Lebanese | 40.3 /100 | #183 | Average 17.4% |
| Immigrants | Costa Rica | 39.0 /100 | #184 | Fair 17.4% |
| Immigrants | Armenia | 38.0 /100 | #185 | Fair 17.5% |
| Immigrants | Bosnia and Herzegovina | 35.0 /100 | #186 | Fair 17.5% |
| Kenyans | 34.7 /100 | #187 | Fair 17.5% |
| Carpatho Rusyns | 33.6 /100 | #188 | Fair 17.5% |
| French | 33.6 /100 | #189 | Fair 17.5% |
| Slovaks | 29.2 /100 | #190 | Fair 17.6% |
| Immigrants | Afghanistan | 27.9 /100 | #191 | Fair 17.7% |
| Immigrants | Uruguay | 27.8 /100 | #192 | Fair 17.7% |
Demographics Similar to Argentineans by Child Poverty Under the Age of 5
In terms of child poverty under the age of 5, the demographic groups most similar to Argentineans are Immigrants from Argentina (15.4%, a difference of 0.15%), Croatian (15.4%, a difference of 0.15%), Immigrants from Ukraine (15.3%, a difference of 0.36%), Immigrants from Turkey (15.4%, a difference of 0.36%), and Immigrants from Sweden (15.3%, a difference of 0.59%).
| Demographics | Rating | Rank | Child Poverty Under the Age of 5 |
| Greeks | 99.0 /100 | #67 | Exceptional 15.2% |
| Zimbabweans | 99.0 /100 | #68 | Exceptional 15.2% |
| Lithuanians | 99.0 /100 | #69 | Exceptional 15.2% |
| Immigrants | Belgium | 98.8 /100 | #70 | Exceptional 15.3% |
| Immigrants | Egypt | 98.8 /100 | #71 | Exceptional 15.3% |
| Immigrants | Sweden | 98.8 /100 | #72 | Exceptional 15.3% |
| Immigrants | Ukraine | 98.7 /100 | #73 | Exceptional 15.3% |
| Argentineans | 98.5 /100 | #74 | Exceptional 15.4% |
| Immigrants | Argentina | 98.5 /100 | #75 | Exceptional 15.4% |
| Croatians | 98.5 /100 | #76 | Exceptional 15.4% |
| Immigrants | Turkey | 98.3 /100 | #77 | Exceptional 15.4% |
| Sri Lankans | 98.1 /100 | #78 | Exceptional 15.5% |
| Australians | 98.0 /100 | #79 | Exceptional 15.5% |
| Italians | 97.9 /100 | #80 | Exceptional 15.5% |
| Czechs | 97.8 /100 | #81 | Exceptional 15.5% |