Nonimmigrants vs Immigrants from Southern Europe Female Poverty Among 18-24 Year Olds

COMPARE

Nonimmigrants
Race
Ancestry
AfghanAfricanAlaska NativeAlaskan AthabascanAlbanianAleutAlsatianAmericanApacheArabArapahoArgentineanArmenianAssyrian/Chaldean/SyriacAustralianAustrianBahamianBangladeshiBarbadianBasqueBelgianBelizeanBermudanBhutaneseBlackfeetBolivianBrazilianBritishBritish West IndianBulgarianBurmeseCajunCambodianCanadianCape VerdeanCarpatho RusynCelticCentral AmericanCentral American IndianCherokeeCheyenneChickasawChileanChineseChippewaChoctawColombianColvilleComancheCosta RicanCreeCreekCroatianCrowCubanCypriotCzechCzechoslovakianDanishDelawareDominicanDutchDutch West IndianEastern EuropeanEcuadorianEgyptianEnglishEstonianEthiopianEuropeanFijianFilipinoFinnishFrenchFrench American IndianFrench CanadianGermanGerman RussianGhanaianGreekGuamanian/ChamorroGuatemalanGuyaneseHaitianHmongHonduranHopiHoumaHungarianIcelanderIndian (Asian)IndonesianInupiatIranianIraqiIrishIroquoisIsraeliItalianJamaicanJapaneseJordanianKenyanKiowaKoreanLaotianLatvianLebaneseLiberianLithuanianLumbeeLuxembourgerMacedonianMalaysianMalteseMarshalleseMenomineeMexicanMexican American IndianMongolianMoroccanNative HawaiianNavajoNepaleseNew ZealanderNicaraguanNigerianNorthern EuropeanNorwegianOkinawanOsageOttawaPaiutePakistaniPalestinianPanamanianParaguayanPennsylvania GermanPeruvianPimaPolishPortuguesePotawatomiPuebloPuerto RicanPuget Sound SalishRomanianRussianSalvadoranSamoanScandinavianScotch-IrishScottishSeminoleSenegaleseSerbianShoshoneSierra LeoneanSiouxSlavicSlovakSloveneSomaliSouth AfricanSouth AmericanSouth American IndianSoviet UnionSpaniardSpanishSpanish AmericanSpanish American IndianSri LankanSubsaharan AfricanSudaneseSwedishSwissSyrianTaiwaneseThaiTlingit-HaidaTohono O'OdhamTonganTrinidadian and TobagonianTsimshianTurkishU.S. Virgin IslanderUgandanUkrainianUruguayanUteVenezuelanVietnameseWelshWest IndianYakamaYaquiYugoslavianYumanYup'ikZimbabwean
Immigration
NonimmigrantsImmigrantsAfghanistanAfricaAlbaniaArgentinaArmeniaAsiaAustraliaAustriaBahamasBangladeshBarbadosBelarusBelgiumBelizeBoliviaBosnia and HerzegovinaBrazilBulgariaBurma/MyanmarCabo VerdeCambodiaCameroonCanadaCaribbeanCentral AmericaChileChinaColombiaCongoCosta RicaCroatiaCubaCzechoslovakiaDenmarkDominicaDominican RepublicEastern AfricaEastern AsiaEastern EuropeEcuadorEgyptEl SalvadorEnglandEritreaEthiopiaEuropeFijiFranceGermanyGhanaGreeceGrenadaGuatemalaGuyanaHaitiHondurasHong KongHungaryIndiaIndonesiaIranIraqIrelandIsraelItalyJamaicaJapanJordanKazakhstanKenyaKoreaKuwaitLaosLatin AmericaLatviaLebanonLiberiaLithuaniaMalaysiaMexicoMicronesiaMiddle AfricaMoldovaMoroccoNepalNetherlandsNicaraguaNigeriaNorth AmericaNorth MacedoniaNorthern AfricaNorthern EuropeNorwayOceaniaPakistanPanamaPeruPhilippinesPolandPortugalRomaniaRussiaSaudi ArabiaScotlandSenegalSerbiaSierra LeoneSingaporeSomaliaSouth AfricaSouth AmericaSouth Central AsiaSouth Eastern AsiaSpainSri LankaSt. Vincent and the GrenadinesSudanSwedenSwitzerlandSyriaTaiwanThailandTrinidad and TobagoTurkeyUgandaUkraineUruguayUzbekistanVenezuelaVietnamWest IndiesWestern AfricaWestern AsiaWestern EuropeYemenZaireZimbabweAzores
Immigrants from Southern Europe
Race
Ancestry
AfghanAfricanAlaska NativeAlaskan AthabascanAlbanianAleutAlsatianAmericanApacheArabArapahoArgentineanArmenianAssyrian/Chaldean/SyriacAustralianAustrianBahamianBangladeshiBarbadianBasqueBelgianBelizeanBermudanBhutaneseBlackfeetBolivianBrazilianBritishBritish West IndianBulgarianBurmeseCajunCambodianCanadianCape VerdeanCarpatho RusynCelticCentral AmericanCentral American IndianCherokeeCheyenneChickasawChileanChineseChippewaChoctawColombianColvilleComancheCosta RicanCreeCreekCroatianCrowCubanCypriotCzechCzechoslovakianDanishDelawareDominicanDutchDutch West IndianEastern EuropeanEcuadorianEgyptianEnglishEstonianEthiopianEuropeanFijianFilipinoFinnishFrenchFrench American IndianFrench CanadianGermanGerman RussianGhanaianGreekGuamanian/ChamorroGuatemalanGuyaneseHaitianHmongHonduranHopiHoumaHungarianIcelanderIndian (Asian)IndonesianInupiatIranianIraqiIrishIroquoisIsraeliItalianJamaicanJapaneseJordanianKenyanKiowaKoreanLaotianLatvianLebaneseLiberianLithuanianLumbeeLuxembourgerMacedonianMalaysianMalteseMarshalleseMenomineeMexicanMexican American IndianMongolianMoroccanNative HawaiianNavajoNepaleseNew ZealanderNicaraguanNigerianNorthern EuropeanNorwegianOkinawanOsageOttawaPaiutePakistaniPalestinianPanamanianParaguayanPennsylvania GermanPeruvianPimaPolishPortuguesePotawatomiPuebloPuerto RicanPuget Sound SalishRomanianRussianSalvadoranSamoanScandinavianScotch-IrishScottishSeminoleSenegaleseSerbianShoshoneSierra LeoneanSiouxSlavicSlovakSloveneSomaliSouth AfricanSouth AmericanSouth American IndianSoviet UnionSpaniardSpanishSpanish AmericanSpanish American IndianSri LankanSubsaharan AfricanSudaneseSwedishSwissSyrianTaiwaneseThaiTlingit-HaidaTohono O'OdhamTonganTrinidadian and TobagonianTsimshianTurkishU.S. Virgin IslanderUgandanUkrainianUruguayanUteVenezuelanVietnameseWelshWest IndianYakamaYaquiYugoslavianYumanYup'ikZimbabwean
Immigration
ImmigrantsAfghanistanAfricaAlbaniaArgentinaArmeniaAsiaAustraliaAustriaBahamasBangladeshBarbadosBelarusBelgiumBelizeBoliviaBosnia and HerzegovinaBrazilBulgariaBurma/MyanmarCabo VerdeCambodiaCameroonCanadaCaribbeanCentral AmericaChileChinaColombiaCongoCosta RicaCroatiaCubaCzechoslovakiaDenmarkDominicaDominican RepublicEastern AfricaEastern AsiaEastern EuropeEcuadorEgyptEl SalvadorEnglandEritreaEthiopiaEuropeFijiFranceGermanyGhanaGreeceGrenadaGuatemalaGuyanaHaitiHondurasHong KongHungaryIndiaIndonesiaIranIraqIrelandIsraelItalyJamaicaJapanJordanKazakhstanKenyaKoreaKuwaitLaosLatin AmericaLatviaLebanonLiberiaLithuaniaMalaysiaMexicoMicronesiaMiddle AfricaMoldovaMoroccoNepalNetherlandsNicaraguaNigeriaNorth AmericaNorth MacedoniaNorthern AfricaNorthern EuropeNorwayOceaniaPakistanPanamaPeruPhilippinesPolandPortugalRomaniaRussiaSaudi ArabiaScotlandSenegalSerbiaSierra LeoneSingaporeSomaliaSouth AfricaSouth AmericaSouth Central AsiaSouth Eastern AsiaSouthern EuropeSpainSri LankaSt. Vincent and the GrenadinesSudanSwedenSwitzerlandSyriaTaiwanThailandTrinidad and TobagoTurkeyUgandaUkraineUruguayUzbekistanVenezuelaVietnamWest IndiesWestern AfricaWestern AsiaWestern EuropeYemenZaireZimbabweAzores
Female Poverty Among 18-24 Year Olds
Income
Poverty
Unemployment
Labor Participation
Family Structure
Vehicle Availability
Education Level
Disability

Female Poverty Among 18-24 Year Olds Comparison

Nonimmigrants

Immigrants from Southern Europe

Tragic
Exceptional
21.5%
FEMALE POVERTY AMONG 18-24 YEAR OLDS
0.3/ 100
METRIC RATING
265th/ 347
METRIC RANK
18.2%
FEMALE POVERTY AMONG 18-24 YEAR OLDS
100.0/ 100
METRIC RATING
46th/ 347
METRIC RANK

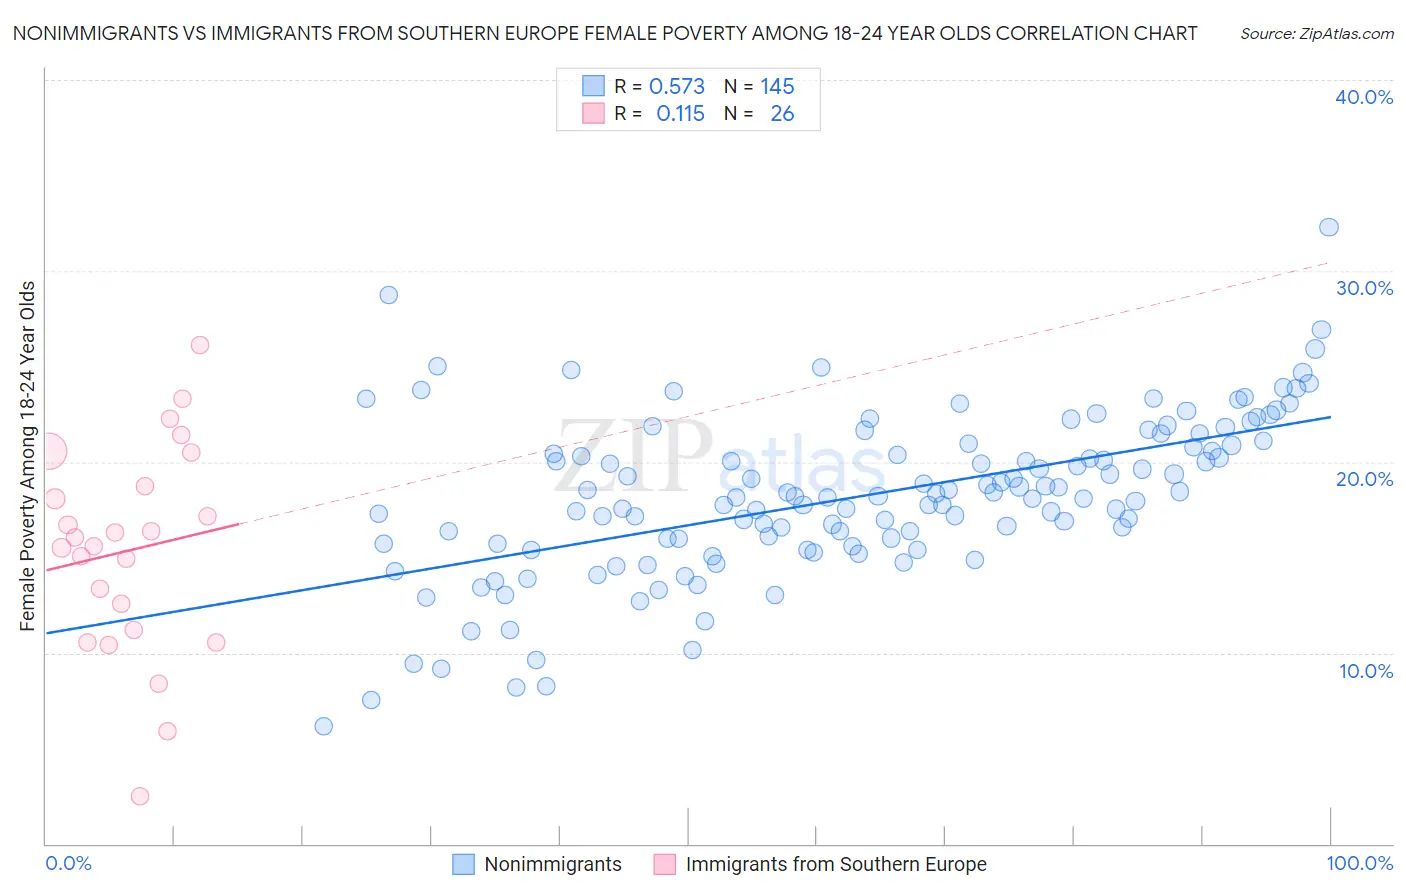
Nonimmigrants vs Immigrants from Southern Europe Female Poverty Among 18-24 Year Olds Correlation Chart

The statistical analysis conducted on geographies consisting of 546,044,220 people shows a substantial positive correlation between the proportion of Nonimmigrants and poverty level among females between the ages 18 and 24 in the United States with a correlation coefficient (R) of 0.573 and weighted average of 21.5%. Similarly, the statistical analysis conducted on geographies consisting of 389,452,737 people shows a poor positive correlation between the proportion of Immigrants from Southern Europe and poverty level among females between the ages 18 and 24 in the United States with a correlation coefficient (R) of 0.115 and weighted average of 18.2%, a difference of 18.4%.
Nonimmigrants vs Immigrants from Southern Europe Female Poverty Among 18-24 Year Olds

Female Poverty Among 18-24 Year Olds Correlation Summary

MeasurementNonimmigrantsImmigrants from Southern Europe
Minimum6.2%2.5%
Maximum32.3%26.1%
Range26.1%23.6%
Mean18.2%15.4%
Median18.2%15.8%
Interquartile 25% (IQ1)15.7%11.2%
Interquartile 75% (IQ3)20.9%18.7%
Interquartile Range (IQR)5.2%7.5%
Standard Deviation (Sample)4.3%5.5%
Standard Deviation (Population)4.2%5.4%

Similar Demographics by Female Poverty Among 18-24 Year Olds

Demographics Similar to Nonimmigrants by Female Poverty Among 18-24 Year Olds

In terms of female poverty among 18-24 year olds, the demographic groups most similar to Nonimmigrants are Honduran (21.5%, a difference of 0.010%), Icelander (21.5%, a difference of 0.060%), Alaska Native (21.5%, a difference of 0.070%), American (21.6%, a difference of 0.15%), and Immigrants from Burma/Myanmar (21.6%, a difference of 0.30%).
DemographicsRating | RankFemale Poverty Among 18-24 Year Olds
Vietnamese
0.6
/100
|
#258
Tragic
21.4%
Immigrants | France
0.6
/100
|
#259
Tragic
21.4%
Immigrants | Norway
0.6
/100
|
#260
Tragic
21.4%
Immigrants | Bahamas
0.5
/100
|
#261
Tragic
21.4%
Immigrants | Eastern Africa
0.4
/100
|
#262
Tragic
21.4%
Icelanders
0.3
/100
|
#263
Tragic
21.5%
Hondurans
0.3
/100
|
#264
Tragic
21.5%
Immigrants | Nonimmigrants
0.3
/100
|
#265
Tragic
21.5%
Alaska Natives
0.3
/100
|
#266
Tragic
21.5%
Americans
0.3
/100
|
#267
Tragic
21.6%
Immigrants | Burma/Myanmar
0.2
/100
|
#268
Tragic
21.6%
Celtics
0.2
/100
|
#269
Tragic
21.6%
Mongolians
0.2
/100
|
#270
Tragic
21.6%
Scotch-Irish
0.2
/100
|
#271
Tragic
21.6%
Basques
0.2
/100
|
#272
Tragic
21.7%

Demographics Similar to Immigrants from Southern Europe by Female Poverty Among 18-24 Year Olds

In terms of female poverty among 18-24 year olds, the demographic groups most similar to Immigrants from Southern Europe are Asian (18.2%, a difference of 0.080%), Sri Lankan (18.2%, a difference of 0.13%), Bhutanese (18.2%, a difference of 0.16%), Samoan (18.2%, a difference of 0.27%), and Spanish American Indian (18.1%, a difference of 0.28%).
DemographicsRating | RankFemale Poverty Among 18-24 Year Olds
Puget Sound Salish
100.0
/100
|
#39
Exceptional
18.0%
Immigrants | Romania
100.0
/100
|
#40
Exceptional
18.0%
Immigrants | Argentina
100.0
/100
|
#41
Exceptional
18.0%
Bulgarians
100.0
/100
|
#42
Exceptional
18.1%
Macedonians
100.0
/100
|
#43
Exceptional
18.1%
Nicaraguans
100.0
/100
|
#44
Exceptional
18.1%
Spanish American Indians
100.0
/100
|
#45
Exceptional
18.1%
Immigrants | Southern Europe
100.0
/100
|
#46
Exceptional
18.2%
Asians
100.0
/100
|
#47
Exceptional
18.2%
Sri Lankans
100.0
/100
|
#48
Exceptional
18.2%
Bhutanese
100.0
/100
|
#49
Exceptional
18.2%
Samoans
100.0
/100
|
#50
Exceptional
18.2%
Immigrants | Eastern Europe
99.9
/100
|
#51
Exceptional
18.2%
Immigrants | Ireland
99.9
/100
|
#52
Exceptional
18.3%
Italians
99.9
/100
|
#53
Exceptional
18.3%