Nicaraguan vs Zimbabwean Female Poverty Among 25-34 Year Olds
COMPARE
Nicaraguan
Zimbabwean
Female Poverty Among 25-34 Year Olds
Female Poverty Among 25-34 Year Olds Comparison
Nicaraguans
Zimbabweans
14.5%
FEMALE POVERTY AMONG 25-34 YEAR OLDS
3.3/ 100
METRIC RATING
226th/ 347
METRIC RANK
11.7%
FEMALE POVERTY AMONG 25-34 YEAR OLDS
99.9/ 100
METRIC RATING
34th/ 347
METRIC RANK
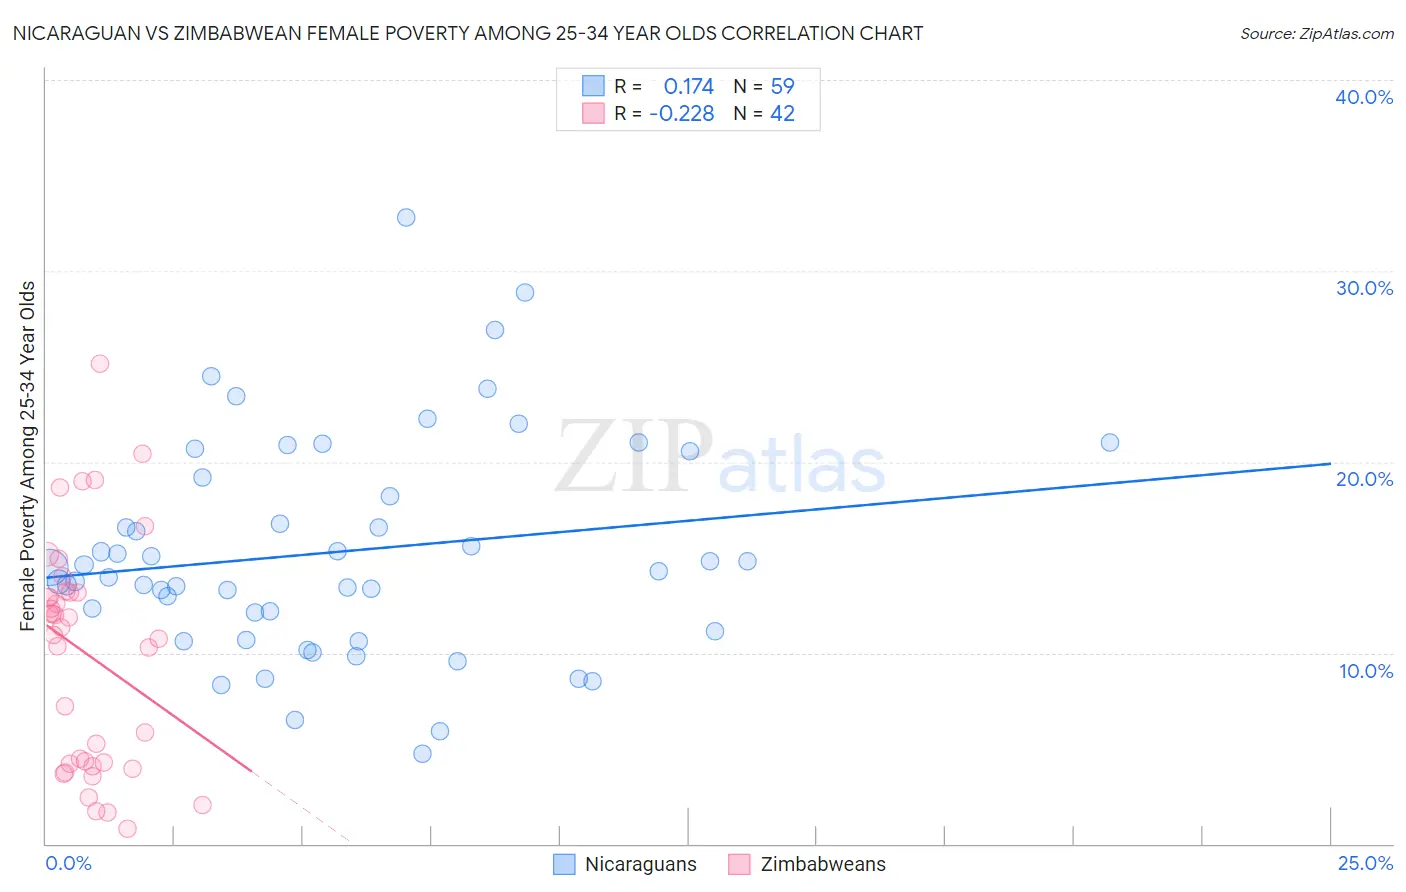
Nicaraguan vs Zimbabwean Female Poverty Among 25-34 Year Olds Correlation Chart
The statistical analysis conducted on geographies consisting of 283,781,399 people shows a poor positive correlation between the proportion of Nicaraguans and poverty level among females between the ages 25 and 34 in the United States with a correlation coefficient (R) of 0.174 and weighted average of 14.5%. Similarly, the statistical analysis conducted on geographies consisting of 69,074,589 people shows a weak negative correlation between the proportion of Zimbabweans and poverty level among females between the ages 25 and 34 in the United States with a correlation coefficient (R) of -0.228 and weighted average of 11.7%, a difference of 24.2%.
Female Poverty Among 25-34 Year Olds Correlation Summary
| Measurement | Nicaraguan | Zimbabwean |
| Minimum | 4.7% | 0.80% |
| Maximum | 32.8% | 25.2% |
| Range | 28.1% | 24.4% |
| Mean | 15.3% | 10.0% |
| Median | 14.3% | 11.2% |
| Interquartile 25% (IQ1) | 11.1% | 4.2% |
| Interquartile 75% (IQ3) | 19.2% | 13.2% |
| Interquartile Range (IQR) | 8.1% | 9.0% |
| Standard Deviation (Sample) | 5.7% | 6.0% |
| Standard Deviation (Population) | 5.7% | 5.9% |
Similar Demographics by Female Poverty Among 25-34 Year Olds
Demographics Similar to Nicaraguans by Female Poverty Among 25-34 Year Olds
In terms of female poverty among 25-34 year olds, the demographic groups most similar to Nicaraguans are Immigrants from Barbados (14.5%, a difference of 0.080%), Celtic (14.5%, a difference of 0.30%), Immigrants from Sudan (14.4%, a difference of 0.40%), Nigerian (14.4%, a difference of 0.47%), and Vietnamese (14.6%, a difference of 0.47%).
| Demographics | Rating | Rank | Female Poverty Among 25-34 Year Olds |
| Ecuadorians | 5.2 /100 | #219 | Tragic 14.3% |
| Ghanaians | 4.8 /100 | #220 | Tragic 14.4% |
| Sudanese | 4.4 /100 | #221 | Tragic 14.4% |
| Immigrants | Portugal | 4.3 /100 | #222 | Tragic 14.4% |
| Nigerians | 4.2 /100 | #223 | Tragic 14.4% |
| Immigrants | Sudan | 4.0 /100 | #224 | Tragic 14.4% |
| Immigrants | Barbados | 3.4 /100 | #225 | Tragic 14.5% |
| Nicaraguans | 3.3 /100 | #226 | Tragic 14.5% |
| Celtics | 2.8 /100 | #227 | Tragic 14.5% |
| Vietnamese | 2.6 /100 | #228 | Tragic 14.6% |
| Spanish | 2.5 /100 | #229 | Tragic 14.6% |
| Spaniards | 2.3 /100 | #230 | Tragic 14.6% |
| Delaware | 2.3 /100 | #231 | Tragic 14.6% |
| Immigrants | Ecuador | 1.9 /100 | #232 | Tragic 14.6% |
| Whites/Caucasians | 1.8 /100 | #233 | Tragic 14.7% |
Demographics Similar to Zimbabweans by Female Poverty Among 25-34 Year Olds
In terms of female poverty among 25-34 year olds, the demographic groups most similar to Zimbabweans are Immigrants from Poland (11.6%, a difference of 0.22%), Cambodian (11.7%, a difference of 0.27%), Immigrants from Asia (11.6%, a difference of 0.57%), Immigrants from Sri Lanka (11.8%, a difference of 0.76%), and Immigrants from Japan (11.6%, a difference of 0.87%).
| Demographics | Rating | Rank | Female Poverty Among 25-34 Year Olds |
| Immigrants | Greece | 99.9 /100 | #27 | Exceptional 11.5% |
| Immigrants | Pakistan | 99.9 /100 | #28 | Exceptional 11.5% |
| Bulgarians | 99.9 /100 | #29 | Exceptional 11.5% |
| Cypriots | 99.9 /100 | #30 | Exceptional 11.5% |
| Immigrants | Japan | 99.9 /100 | #31 | Exceptional 11.6% |
| Immigrants | Asia | 99.9 /100 | #32 | Exceptional 11.6% |
| Immigrants | Poland | 99.9 /100 | #33 | Exceptional 11.6% |
| Zimbabweans | 99.9 /100 | #34 | Exceptional 11.7% |
| Cambodians | 99.9 /100 | #35 | Exceptional 11.7% |
| Immigrants | Sri Lanka | 99.8 /100 | #36 | Exceptional 11.8% |
| Taiwanese | 99.8 /100 | #37 | Exceptional 11.8% |
| Immigrants | North Macedonia | 99.8 /100 | #38 | Exceptional 11.8% |
| Latvians | 99.8 /100 | #39 | Exceptional 11.8% |
| Immigrants | Bulgaria | 99.8 /100 | #40 | Exceptional 11.8% |
| Immigrants | Indonesia | 99.8 /100 | #41 | Exceptional 11.8% |