New Zealander vs Immigrants from St. Vincent and the Grenadines Female Poverty Among 18-24 Year Olds
COMPARE
New Zealander
Immigrants from St. Vincent and the Grenadines
Female Poverty Among 18-24 Year Olds
Female Poverty Among 18-24 Year Olds Comparison
New Zealanders
Immigrants from St. Vincent and the Grenadines
21.7%
FEMALE POVERTY AMONG 18-24 YEAR OLDS
0.2/ 100
METRIC RATING
273rd/ 347
METRIC RANK
20.8%
FEMALE POVERTY AMONG 18-24 YEAR OLDS
6.0/ 100
METRIC RATING
231st/ 347
METRIC RANK
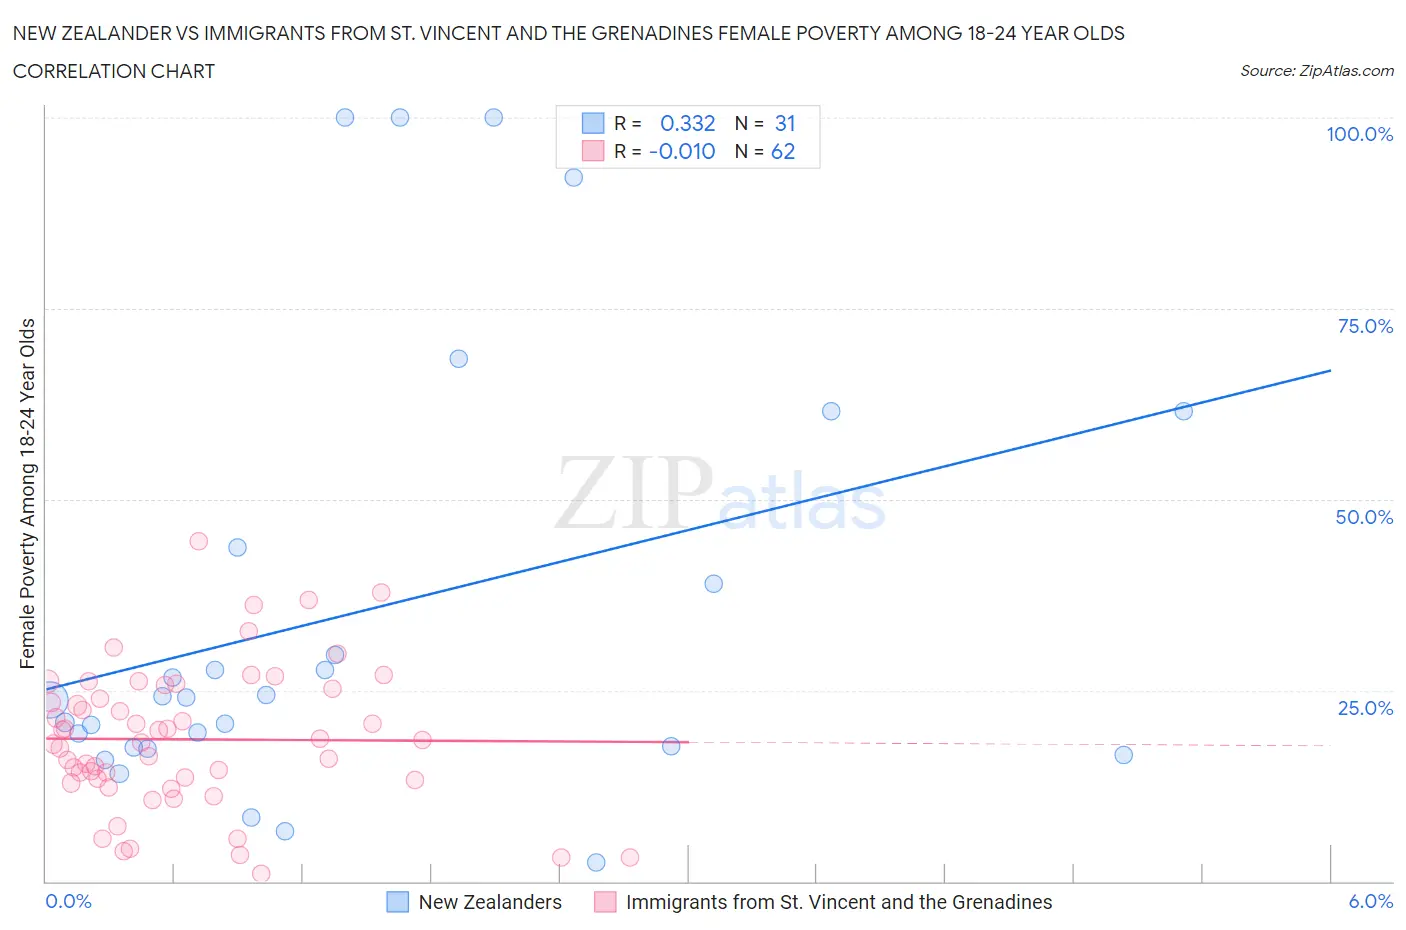
New Zealander vs Immigrants from St. Vincent and the Grenadines Female Poverty Among 18-24 Year Olds Correlation Chart
The statistical analysis conducted on geographies consisting of 106,255,295 people shows a mild positive correlation between the proportion of New Zealanders and poverty level among females between the ages 18 and 24 in the United States with a correlation coefficient (R) of 0.332 and weighted average of 21.7%. Similarly, the statistical analysis conducted on geographies consisting of 56,017,716 people shows no correlation between the proportion of Immigrants from St. Vincent and the Grenadines and poverty level among females between the ages 18 and 24 in the United States with a correlation coefficient (R) of -0.010 and weighted average of 20.8%, a difference of 4.4%.
Female Poverty Among 18-24 Year Olds Correlation Summary
| Measurement | New Zealander | Immigrants from St. Vincent and the Grenadines |
| Minimum | 2.5% | 0.92% |
| Maximum | 100.0% | 44.4% |
| Range | 97.5% | 43.5% |
| Mean | 35.2% | 18.6% |
| Median | 24.0% | 18.3% |
| Interquartile 25% (IQ1) | 17.5% | 13.3% |
| Interquartile 75% (IQ3) | 43.7% | 25.2% |
| Interquartile Range (IQR) | 26.2% | 12.0% |
| Standard Deviation (Sample) | 28.9% | 9.2% |
| Standard Deviation (Population) | 28.4% | 9.2% |
Similar Demographics by Female Poverty Among 18-24 Year Olds
Demographics Similar to New Zealanders by Female Poverty Among 18-24 Year Olds
In terms of female poverty among 18-24 year olds, the demographic groups most similar to New Zealanders are Basque (21.7%, a difference of 0.14%), Immigrants from Honduras (21.8%, a difference of 0.39%), Scotch-Irish (21.6%, a difference of 0.41%), Mongolian (21.6%, a difference of 0.43%), and Immigrants from Bangladesh (21.8%, a difference of 0.43%).
| Demographics | Rating | Rank | Female Poverty Among 18-24 Year Olds |
| Alaska Natives | 0.3 /100 | #266 | Tragic 21.5% |
| Americans | 0.3 /100 | #267 | Tragic 21.6% |
| Immigrants | Burma/Myanmar | 0.2 /100 | #268 | Tragic 21.6% |
| Celtics | 0.2 /100 | #269 | Tragic 21.6% |
| Mongolians | 0.2 /100 | #270 | Tragic 21.6% |
| Scotch-Irish | 0.2 /100 | #271 | Tragic 21.6% |
| Basques | 0.2 /100 | #272 | Tragic 21.7% |
| New Zealanders | 0.2 /100 | #273 | Tragic 21.7% |
| Immigrants | Honduras | 0.1 /100 | #274 | Tragic 21.8% |
| Immigrants | Bangladesh | 0.1 /100 | #275 | Tragic 21.8% |
| Bahamians | 0.1 /100 | #276 | Tragic 21.8% |
| Immigrants | Switzerland | 0.1 /100 | #277 | Tragic 21.8% |
| Yaqui | 0.1 /100 | #278 | Tragic 21.9% |
| Spanish Americans | 0.1 /100 | #279 | Tragic 21.9% |
| Immigrants | Dominica | 0.1 /100 | #280 | Tragic 21.9% |
Demographics Similar to Immigrants from St. Vincent and the Grenadines by Female Poverty Among 18-24 Year Olds
In terms of female poverty among 18-24 year olds, the demographic groups most similar to Immigrants from St. Vincent and the Grenadines are Finnish (20.8%, a difference of 0.0%), White/Caucasian (20.8%, a difference of 0.020%), Australian (20.8%, a difference of 0.030%), Immigrants from Denmark (20.8%, a difference of 0.040%), and Ghanaian (20.8%, a difference of 0.090%).
| Demographics | Rating | Rank | Female Poverty Among 18-24 Year Olds |
| Immigrants | Liberia | 7.6 /100 | #224 | Tragic 20.7% |
| Norwegians | 7.3 /100 | #225 | Tragic 20.7% |
| Estonians | 7.2 /100 | #226 | Tragic 20.7% |
| Immigrants | Sweden | 6.8 /100 | #227 | Tragic 20.7% |
| Ghanaians | 6.5 /100 | #228 | Tragic 20.8% |
| Australians | 6.1 /100 | #229 | Tragic 20.8% |
| Whites/Caucasians | 6.1 /100 | #230 | Tragic 20.8% |
| Immigrants | St. Vincent and the Grenadines | 6.0 /100 | #231 | Tragic 20.8% |
| Finns | 6.0 /100 | #232 | Tragic 20.8% |
| Immigrants | Denmark | 5.8 /100 | #233 | Tragic 20.8% |
| Welsh | 5.4 /100 | #234 | Tragic 20.8% |
| Immigrants | Uganda | 5.1 /100 | #235 | Tragic 20.8% |
| Okinawans | 4.9 /100 | #236 | Tragic 20.8% |
| Scottish | 4.5 /100 | #237 | Tragic 20.9% |
| Immigrants | Singapore | 4.4 /100 | #238 | Tragic 20.9% |