Nepalese vs Paiute Child Poverty Among Girls Under 16

COMPARE

Nepalese
Race
Ancestry
AfghanAfricanAlaska NativeAlaskan AthabascanAlbanianAleutAlsatianAmericanApacheArabArapahoArgentineanArmenianAssyrian/Chaldean/SyriacAustralianAustrianBahamianBangladeshiBarbadianBasqueBelgianBelizeanBermudanBhutaneseBlackfeetBolivianBrazilianBritishBritish West IndianBulgarianBurmeseCajunCambodianCanadianCape VerdeanCarpatho RusynCelticCentral AmericanCentral American IndianCherokeeCheyenneChickasawChileanChineseChippewaChoctawColombianColvilleComancheCosta RicanCreeCreekCroatianCrowCubanCypriotCzechCzechoslovakianDanishDelawareDominicanDutchDutch West IndianEastern EuropeanEcuadorianEgyptianEnglishEstonianEthiopianEuropeanFijianFilipinoFinnishFrenchFrench American IndianFrench CanadianGermanGerman RussianGhanaianGreekGuamanian/ChamorroGuatemalanGuyaneseHaitianHmongHonduranHopiHoumaHungarianIcelanderIndian (Asian)IndonesianInupiatIranianIraqiIrishIroquoisIsraeliItalianJamaicanJapaneseJordanianKenyanKiowaKoreanLaotianLatvianLebaneseLiberianLithuanianLumbeeLuxembourgerMacedonianMalaysianMalteseMarshalleseMenomineeMexicanMexican American IndianMongolianMoroccanNative HawaiianNavajoNepaleseNew ZealanderNicaraguanNigerianNorthern EuropeanNorwegianOkinawanOsageOttawaPakistaniPalestinianPanamanianParaguayanPennsylvania GermanPeruvianPimaPolishPortuguesePotawatomiPuebloPuerto RicanPuget Sound SalishRomanianRussianSalvadoranSamoanScandinavianScotch-IrishScottishSeminoleSenegaleseSerbianShoshoneSierra LeoneanSiouxSlavicSlovakSloveneSomaliSouth AfricanSouth AmericanSouth American IndianSoviet UnionSpaniardSpanishSpanish AmericanSpanish American IndianSri LankanSubsaharan AfricanSudaneseSwedishSwissSyrianTaiwaneseThaiTlingit-HaidaTohono O'OdhamTonganTrinidadian and TobagonianTsimshianTurkishU.S. Virgin IslanderUgandanUkrainianUruguayanUteVenezuelanVietnameseWelshWest IndianYakamaYaquiYugoslavianYumanYup'ikZimbabwean
Immigration
NonimmigrantsImmigrantsAfghanistanAfricaAlbaniaArgentinaArmeniaAsiaAustraliaAustriaBahamasBangladeshBarbadosBelarusBelgiumBelizeBoliviaBosnia and HerzegovinaBrazilBulgariaBurma/MyanmarCabo VerdeCambodiaCameroonCanadaCaribbeanCentral AmericaChileChinaColombiaCongoCosta RicaCroatiaCubaCzechoslovakiaDenmarkDominicaDominican RepublicEastern AfricaEastern AsiaEastern EuropeEcuadorEgyptEl SalvadorEnglandEritreaEthiopiaEuropeFijiFranceGermanyGhanaGreeceGrenadaGuatemalaGuyanaHaitiHondurasHong KongHungaryIndiaIndonesiaIranIraqIrelandIsraelItalyJamaicaJapanJordanKazakhstanKenyaKoreaKuwaitLaosLatin AmericaLatviaLebanonLiberiaLithuaniaMalaysiaMexicoMicronesiaMiddle AfricaMoldovaMoroccoNepalNetherlandsNicaraguaNigeriaNorth AmericaNorth MacedoniaNorthern AfricaNorthern EuropeNorwayOceaniaPakistanPanamaPeruPhilippinesPolandPortugalRomaniaRussiaSaudi ArabiaScotlandSenegalSerbiaSierra LeoneSingaporeSomaliaSouth AfricaSouth AmericaSouth Central AsiaSouth Eastern AsiaSouthern EuropeSpainSri LankaSt. Vincent and the GrenadinesSudanSwedenSwitzerlandSyriaTaiwanThailandTrinidad and TobagoTurkeyUgandaUkraineUruguayUzbekistanVenezuelaVietnamWest IndiesWestern AfricaWestern AsiaWestern EuropeYemenZaireZimbabweAzores
Paiute
Race
Ancestry
AfghanAfricanAlaska NativeAlaskan AthabascanAlbanianAleutAlsatianAmericanApacheArabArapahoArgentineanArmenianAssyrian/Chaldean/SyriacAustralianAustrianBahamianBangladeshiBarbadianBasqueBelgianBelizeanBermudanBhutaneseBlackfeetBolivianBrazilianBritishBritish West IndianBulgarianBurmeseCajunCambodianCanadianCape VerdeanCarpatho RusynCelticCentral AmericanCentral American IndianCherokeeCheyenneChickasawChileanChineseChippewaChoctawColombianColvilleComancheCosta RicanCreeCreekCroatianCrowCubanCypriotCzechCzechoslovakianDanishDelawareDominicanDutchDutch West IndianEastern EuropeanEcuadorianEgyptianEnglishEstonianEthiopianEuropeanFijianFilipinoFinnishFrenchFrench American IndianFrench CanadianGermanGerman RussianGhanaianGreekGuamanian/ChamorroGuatemalanGuyaneseHaitianHmongHonduranHopiHoumaHungarianIcelanderIndian (Asian)IndonesianInupiatIranianIraqiIrishIroquoisIsraeliItalianJamaicanJapaneseJordanianKenyanKiowaKoreanLaotianLatvianLebaneseLiberianLithuanianLumbeeLuxembourgerMacedonianMalaysianMalteseMarshalleseMenomineeMexicanMexican American IndianMongolianMoroccanNative HawaiianNavajoNew ZealanderNicaraguanNigerianNorthern EuropeanNorwegianOkinawanOsageOttawaPaiutePakistaniPalestinianPanamanianParaguayanPennsylvania GermanPeruvianPimaPolishPortuguesePotawatomiPuebloPuerto RicanPuget Sound SalishRomanianRussianSalvadoranSamoanScandinavianScotch-IrishScottishSeminoleSenegaleseSerbianShoshoneSierra LeoneanSiouxSlavicSlovakSloveneSomaliSouth AfricanSouth AmericanSouth American IndianSoviet UnionSpaniardSpanishSpanish AmericanSpanish American IndianSri LankanSubsaharan AfricanSudaneseSwedishSwissSyrianTaiwaneseThaiTlingit-HaidaTohono O'OdhamTonganTrinidadian and TobagonianTsimshianTurkishU.S. Virgin IslanderUgandanUkrainianUruguayanUteVenezuelanVietnameseWelshWest IndianYakamaYaquiYugoslavianYumanYup'ikZimbabwean
Immigration
NonimmigrantsImmigrantsAfghanistanAfricaAlbaniaArgentinaArmeniaAsiaAustraliaAustriaBahamasBangladeshBarbadosBelarusBelgiumBelizeBoliviaBosnia and HerzegovinaBrazilBulgariaBurma/MyanmarCabo VerdeCambodiaCameroonCanadaCaribbeanCentral AmericaChileChinaColombiaCongoCosta RicaCroatiaCubaCzechoslovakiaDenmarkDominicaDominican RepublicEastern AfricaEastern AsiaEastern EuropeEcuadorEgyptEl SalvadorEnglandEritreaEthiopiaEuropeFijiFranceGermanyGhanaGreeceGrenadaGuatemalaGuyanaHaitiHondurasHong KongHungaryIndiaIndonesiaIranIraqIrelandIsraelItalyJamaicaJapanJordanKazakhstanKenyaKoreaKuwaitLaosLatin AmericaLatviaLebanonLiberiaLithuaniaMalaysiaMexicoMicronesiaMiddle AfricaMoldovaMoroccoNepalNetherlandsNicaraguaNigeriaNorth AmericaNorth MacedoniaNorthern AfricaNorthern EuropeNorwayOceaniaPakistanPanamaPeruPhilippinesPolandPortugalRomaniaRussiaSaudi ArabiaScotlandSenegalSerbiaSierra LeoneSingaporeSomaliaSouth AfricaSouth AmericaSouth Central AsiaSouth Eastern AsiaSouthern EuropeSpainSri LankaSt. Vincent and the GrenadinesSudanSwedenSwitzerlandSyriaTaiwanThailandTrinidad and TobagoTurkeyUgandaUkraineUruguayUzbekistanVenezuelaVietnamWest IndiesWestern AfricaWestern AsiaWestern EuropeYemenZaireZimbabweAzores
Child Poverty Among Girls Under 16
Income
Poverty
Unemployment
Labor Participation
Family Structure
Vehicle Availability
Education Level
Disability

Child Poverty Among Girls Under 16 Comparison

Nepalese

Paiute

Tragic
Tragic
18.6%
CHILD POVERTY AMONG GIRLS UNDER 16
1.1/ 100
METRIC RATING
235th/ 347
METRIC RANK
22.6%
CHILD POVERTY AMONG GIRLS UNDER 16
0.0/ 100
METRIC RATING
324th/ 347
METRIC RANK

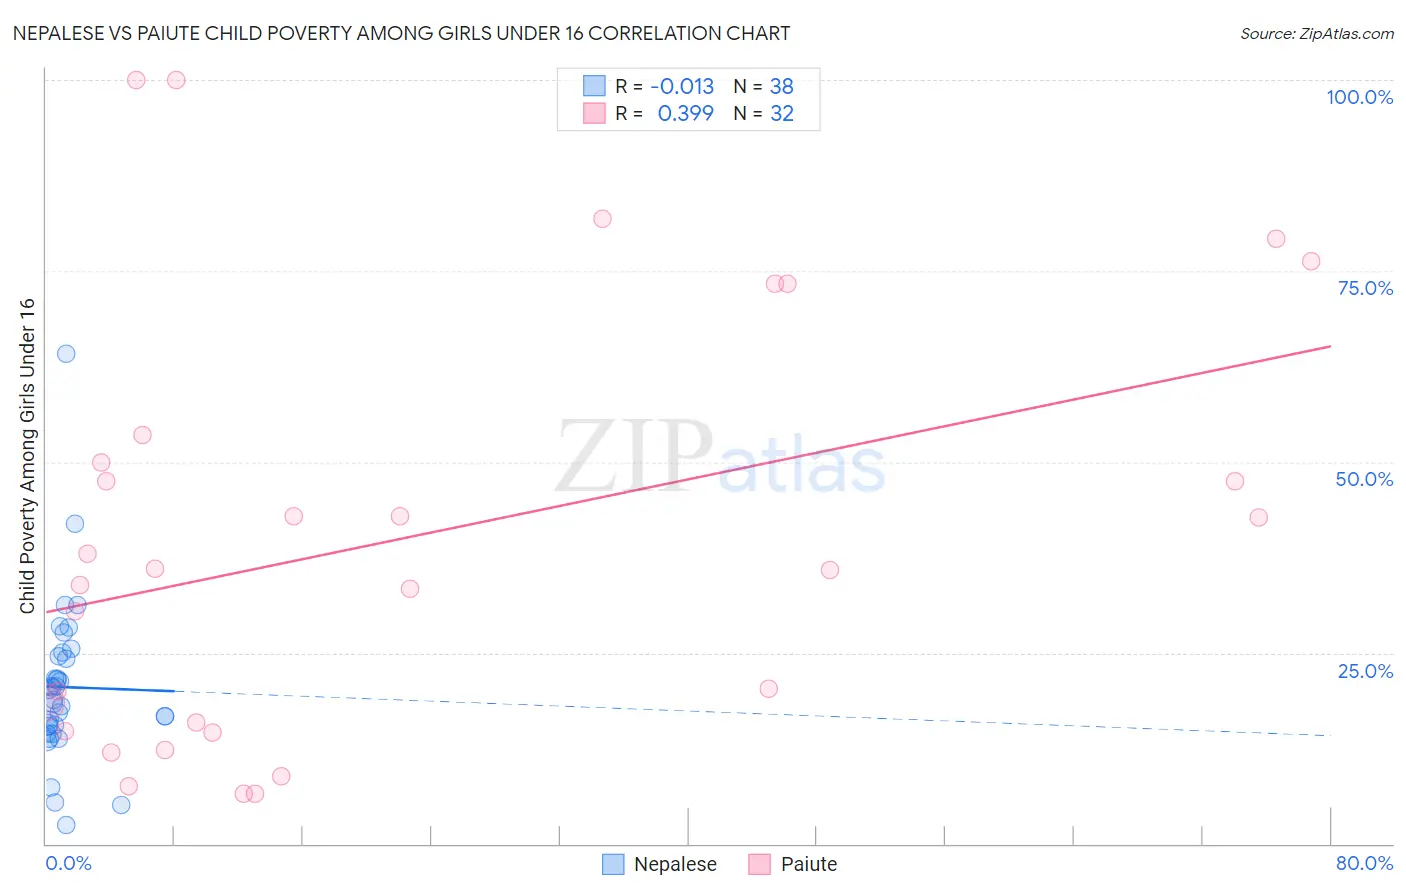
Nepalese vs Paiute Child Poverty Among Girls Under 16 Correlation Chart

The statistical analysis conducted on geographies consisting of 24,511,115 people shows no correlation between the proportion of Nepalese and poverty level among girls under the age of 16 in the United States with a correlation coefficient (R) of -0.013 and weighted average of 18.6%. Similarly, the statistical analysis conducted on geographies consisting of 58,132,859 people shows a mild positive correlation between the proportion of Paiute and poverty level among girls under the age of 16 in the United States with a correlation coefficient (R) of 0.399 and weighted average of 22.6%, a difference of 21.6%.
Nepalese vs Paiute Child Poverty Among Girls Under 16

Child Poverty Among Girls Under 16 Correlation Summary

MeasurementNepalesePaiute
Minimum2.5%6.5%
Maximum64.2%100.0%
Range61.7%93.5%
Mean20.5%39.9%
Median19.5%35.9%
Interquartile 25% (IQ1)15.4%15.3%
Interquartile 75% (IQ3)24.5%51.8%
Interquartile Range (IQR)9.1%36.5%
Standard Deviation (Sample)10.6%27.6%
Standard Deviation (Population)10.5%27.1%

Similar Demographics by Child Poverty Among Girls Under 16

Demographics Similar to Nepalese by Child Poverty Among Girls Under 16

In terms of child poverty among girls under 16, the demographic groups most similar to Nepalese are Alsatian (18.6%, a difference of 0.010%), Fijian (18.6%, a difference of 0.050%), Sudanese (18.6%, a difference of 0.12%), Immigrants from Nigeria (18.6%, a difference of 0.14%), and Immigrants from Sudan (18.6%, a difference of 0.16%).
DemographicsRating | RankChild Poverty Among Girls Under 16
Alaskan Athabascans
2.0
/100
|
#228
Tragic
18.3%
Ghanaians
1.4
/100
|
#229
Tragic
18.5%
Osage
1.3
/100
|
#230
Tragic
18.5%
Cree
1.3
/100
|
#231
Tragic
18.5%
Immigrants | Sudan
1.1
/100
|
#232
Tragic
18.6%
Sudanese
1.1
/100
|
#233
Tragic
18.6%
Fijians
1.1
/100
|
#234
Tragic
18.6%
Nepalese
1.1
/100
|
#235
Tragic
18.6%
Alsatians
1.1
/100
|
#236
Tragic
18.6%
Immigrants | Nigeria
1.0
/100
|
#237
Tragic
18.6%
Immigrants | Eritrea
1.0
/100
|
#238
Tragic
18.7%
Marshallese
0.9
/100
|
#239
Tragic
18.7%
Nigerians
0.9
/100
|
#240
Tragic
18.7%
Americans
0.8
/100
|
#241
Tragic
18.8%
Immigrants | Cuba
0.7
/100
|
#242
Tragic
18.8%

Demographics Similar to Paiute by Child Poverty Among Girls Under 16

In terms of child poverty among girls under 16, the demographic groups most similar to Paiute are Cajun (22.6%, a difference of 0.29%), Yakama (22.6%, a difference of 0.31%), Colville (22.5%, a difference of 0.50%), Immigrants from Congo (22.7%, a difference of 0.50%), and Immigrants from Honduras (22.8%, a difference of 0.63%).
DemographicsRating | RankChild Poverty Among Girls Under 16
Africans
0.0
/100
|
#317
Tragic
21.9%
Immigrants | Dominica
0.0
/100
|
#318
Tragic
22.1%
U.S. Virgin Islanders
0.0
/100
|
#319
Tragic
22.1%
Hondurans
0.0
/100
|
#320
Tragic
22.2%
Colville
0.0
/100
|
#321
Tragic
22.5%
Yakama
0.0
/100
|
#322
Tragic
22.6%
Cajuns
0.0
/100
|
#323
Tragic
22.6%
Paiute
0.0
/100
|
#324
Tragic
22.6%
Immigrants | Congo
0.0
/100
|
#325
Tragic
22.7%
Immigrants | Honduras
0.0
/100
|
#326
Tragic
22.8%
Central American Indians
0.0
/100
|
#327
Tragic
22.8%
Dominicans
0.0
/100
|
#328
Tragic
23.7%
Kiowa
0.0
/100
|
#329
Tragic
23.7%
Immigrants | Dominican Republic
0.0
/100
|
#330
Tragic
23.8%
Apache
0.0
/100
|
#331
Tragic
23.8%