Native/Alaskan vs Immigrants from Pakistan Single Female Poverty
COMPARE
Native/Alaskan
Immigrants from Pakistan
Single Female Poverty
Single Female Poverty Comparison
Natives/Alaskans
Immigrants from Pakistan
28.2%
SINGLE FEMALE POVERTY
0.0/ 100
METRIC RATING
331st/ 347
METRIC RANK
18.4%
SINGLE FEMALE POVERTY
100.0/ 100
METRIC RATING
27th/ 347
METRIC RANK
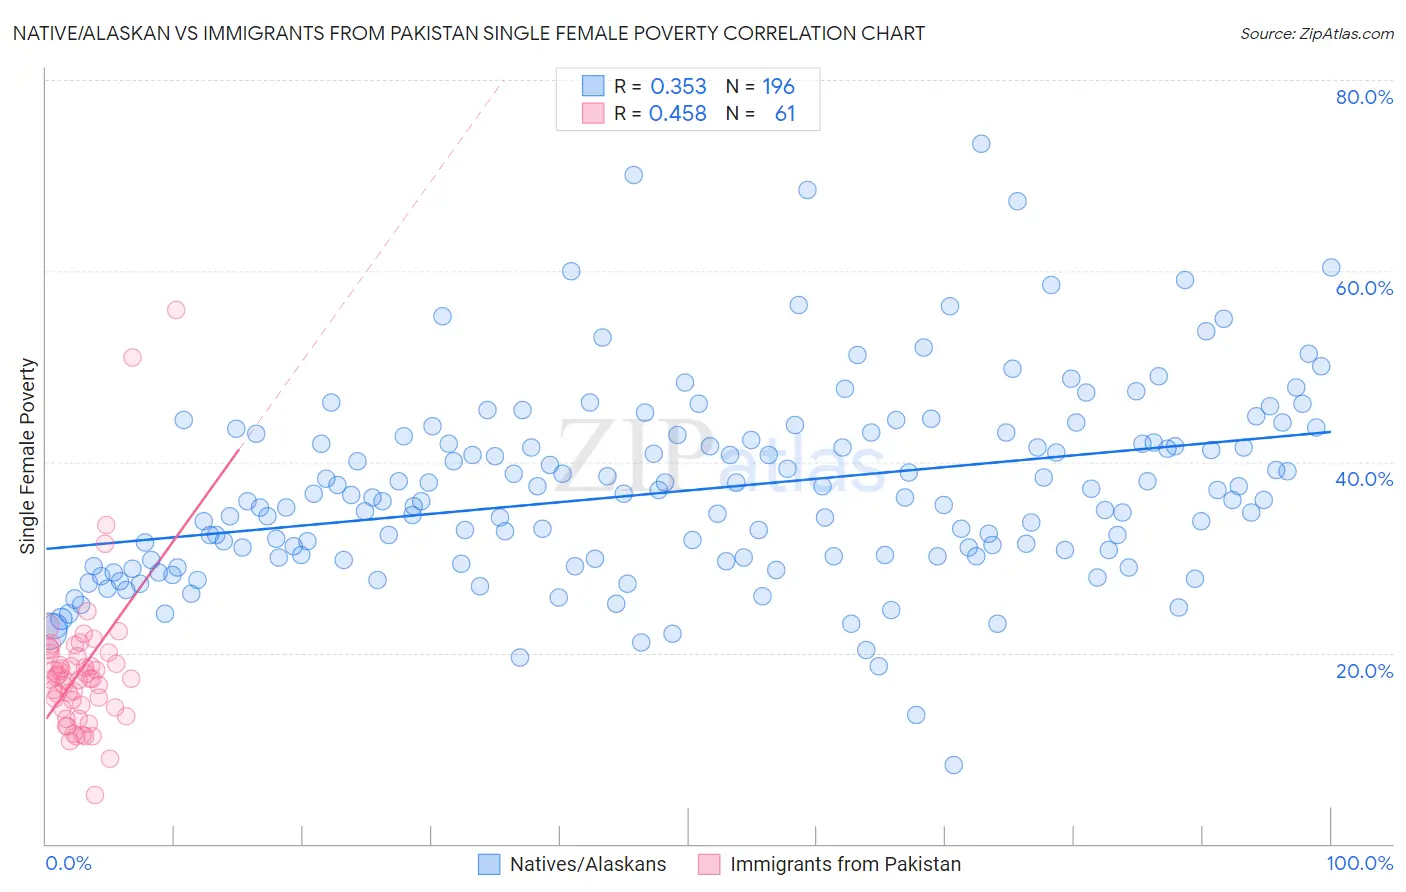
Native/Alaskan vs Immigrants from Pakistan Single Female Poverty Correlation Chart
The statistical analysis conducted on geographies consisting of 503,027,149 people shows a mild positive correlation between the proportion of Natives/Alaskans and poverty level among single females in the United States with a correlation coefficient (R) of 0.353 and weighted average of 28.2%. Similarly, the statistical analysis conducted on geographies consisting of 280,684,274 people shows a moderate positive correlation between the proportion of Immigrants from Pakistan and poverty level among single females in the United States with a correlation coefficient (R) of 0.458 and weighted average of 18.4%, a difference of 53.3%.
Single Female Poverty Correlation Summary
| Measurement | Native/Alaskan | Immigrants from Pakistan |
| Minimum | 8.3% | 5.1% |
| Maximum | 73.3% | 55.9% |
| Range | 65.1% | 50.9% |
| Mean | 37.0% | 18.3% |
| Median | 36.0% | 17.3% |
| Interquartile 25% (IQ1) | 30.0% | 14.2% |
| Interquartile 75% (IQ3) | 42.5% | 20.0% |
| Interquartile Range (IQR) | 12.5% | 5.8% |
| Standard Deviation (Sample) | 10.1% | 8.0% |
| Standard Deviation (Population) | 10.1% | 8.0% |
Similar Demographics by Single Female Poverty
Demographics Similar to Natives/Alaskans by Single Female Poverty
In terms of single female poverty, the demographic groups most similar to Natives/Alaskans are Yakama (28.3%, a difference of 0.26%), Hopi (28.0%, a difference of 0.64%), Ute (28.4%, a difference of 0.68%), Menominee (27.8%, a difference of 1.3%), and Pueblo (28.6%, a difference of 1.4%).
| Demographics | Rating | Rank | Single Female Poverty |
| Kiowa | 0.0 /100 | #324 | Tragic 26.9% |
| Choctaw | 0.0 /100 | #325 | Tragic 27.2% |
| Creek | 0.0 /100 | #326 | Tragic 27.4% |
| Dutch West Indians | 0.0 /100 | #327 | Tragic 27.5% |
| Apache | 0.0 /100 | #328 | Tragic 27.7% |
| Menominee | 0.0 /100 | #329 | Tragic 27.8% |
| Hopi | 0.0 /100 | #330 | Tragic 28.0% |
| Natives/Alaskans | 0.0 /100 | #331 | Tragic 28.2% |
| Yakama | 0.0 /100 | #332 | Tragic 28.3% |
| Ute | 0.0 /100 | #333 | Tragic 28.4% |
| Pueblo | 0.0 /100 | #334 | Tragic 28.6% |
| Immigrants | Yemen | 0.0 /100 | #335 | Tragic 28.9% |
| Colville | 0.0 /100 | #336 | Tragic 29.1% |
| Yuman | 0.0 /100 | #337 | Tragic 29.4% |
| Pima | 0.0 /100 | #338 | Tragic 30.3% |
Demographics Similar to Immigrants from Pakistan by Single Female Poverty
In terms of single female poverty, the demographic groups most similar to Immigrants from Pakistan are Immigrants from Israel (18.3%, a difference of 0.33%), Immigrants from Singapore (18.3%, a difference of 0.36%), Armenian (18.3%, a difference of 0.46%), Immigrants from Moldova (18.5%, a difference of 0.49%), and Immigrants from Poland (18.5%, a difference of 0.59%).
| Demographics | Rating | Rank | Single Female Poverty |
| Immigrants | Greece | 100.0 /100 | #20 | Exceptional 18.3% |
| Maltese | 100.0 /100 | #21 | Exceptional 18.3% |
| Burmese | 100.0 /100 | #22 | Exceptional 18.3% |
| Asians | 100.0 /100 | #23 | Exceptional 18.3% |
| Armenians | 100.0 /100 | #24 | Exceptional 18.3% |
| Immigrants | Singapore | 100.0 /100 | #25 | Exceptional 18.3% |
| Immigrants | Israel | 100.0 /100 | #26 | Exceptional 18.3% |
| Immigrants | Pakistan | 100.0 /100 | #27 | Exceptional 18.4% |
| Immigrants | Moldova | 100.0 /100 | #28 | Exceptional 18.5% |
| Immigrants | Poland | 100.0 /100 | #29 | Exceptional 18.5% |
| Immigrants | North Macedonia | 99.9 /100 | #30 | Exceptional 18.5% |
| Immigrants | Asia | 99.9 /100 | #31 | Exceptional 18.6% |
| Immigrants | Sri Lanka | 99.9 /100 | #32 | Exceptional 18.6% |
| Immigrants | Philippines | 99.9 /100 | #33 | Exceptional 18.6% |
| Koreans | 99.9 /100 | #34 | Exceptional 18.6% |