Native/Alaskan vs Immigrants from Australia Single Mother Poverty

COMPARE

Native/Alaskan
Race
Ancestry
AfghanAfricanAlaska NativeAlaskan AthabascanAlbanianAleutAlsatianAmericanApacheArabArapahoArgentineanArmenianAssyrian/Chaldean/SyriacAustralianAustrianBahamianBangladeshiBarbadianBasqueBelgianBelizeanBermudanBhutaneseBlackfeetBolivianBrazilianBritishBritish West IndianBulgarianBurmeseCajunCambodianCanadianCape VerdeanCarpatho RusynCelticCentral AmericanCentral American IndianCherokeeCheyenneChickasawChileanChineseChippewaChoctawColombianColvilleComancheCosta RicanCreeCreekCroatianCrowCubanCypriotCzechCzechoslovakianDanishDelawareDominicanDutchDutch West IndianEastern EuropeanEcuadorianEgyptianEnglishEstonianEthiopianEuropeanFijianFilipinoFinnishFrenchFrench American IndianFrench CanadianGermanGerman RussianGhanaianGreekGuamanian/ChamorroGuatemalanGuyaneseHaitianHmongHonduranHopiHoumaHungarianIcelanderIndian (Asian)IndonesianInupiatIranianIraqiIrishIroquoisIsraeliItalianJamaicanJapaneseJordanianKenyanKiowaKoreanLaotianLatvianLebaneseLiberianLithuanianLumbeeLuxembourgerMacedonianMalaysianMalteseMarshalleseMenomineeMexicanMexican American IndianMongolianMoroccanNative HawaiianNavajoNepaleseNew ZealanderNicaraguanNigerianNorthern EuropeanNorwegianOkinawanOsageOttawaPaiutePakistaniPalestinianPanamanianParaguayanPennsylvania GermanPeruvianPimaPolishPortuguesePotawatomiPuebloPuerto RicanPuget Sound SalishRomanianRussianSalvadoranSamoanScandinavianScotch-IrishScottishSeminoleSenegaleseSerbianShoshoneSierra LeoneanSiouxSlavicSlovakSloveneSomaliSouth AfricanSouth AmericanSouth American IndianSoviet UnionSpaniardSpanishSpanish AmericanSpanish American IndianSri LankanSubsaharan AfricanSudaneseSwedishSwissSyrianTaiwaneseThaiTlingit-HaidaTohono O'OdhamTonganTrinidadian and TobagonianTsimshianTurkishU.S. Virgin IslanderUgandanUkrainianUruguayanUteVenezuelanVietnameseWelshWest IndianYakamaYaquiYugoslavianYumanYup'ikZimbabwean
Immigration
NonimmigrantsImmigrantsAfghanistanAfricaAlbaniaArgentinaArmeniaAsiaAustriaBahamasBangladeshBarbadosBelarusBelgiumBelizeBoliviaBosnia and HerzegovinaBrazilBulgariaBurma/MyanmarCabo VerdeCambodiaCameroonCanadaCaribbeanCentral AmericaChileChinaColombiaCongoCosta RicaCroatiaCubaCzechoslovakiaDenmarkDominicaDominican RepublicEastern AfricaEastern AsiaEastern EuropeEcuadorEgyptEl SalvadorEnglandEritreaEthiopiaEuropeFijiFranceGermanyGhanaGreeceGrenadaGuatemalaGuyanaHaitiHondurasHong KongHungaryIndiaIndonesiaIranIraqIrelandIsraelItalyJamaicaJapanJordanKazakhstanKenyaKoreaKuwaitLaosLatin AmericaLatviaLebanonLiberiaLithuaniaMalaysiaMexicoMicronesiaMiddle AfricaMoldovaMoroccoNepalNetherlandsNicaraguaNigeriaNorth AmericaNorth MacedoniaNorthern AfricaNorthern EuropeNorwayOceaniaPakistanPanamaPeruPhilippinesPolandPortugalRomaniaRussiaSaudi ArabiaScotlandSenegalSerbiaSierra LeoneSingaporeSomaliaSouth AfricaSouth AmericaSouth Central AsiaSouth Eastern AsiaSouthern EuropeSpainSri LankaSt. Vincent and the GrenadinesSudanSwedenSwitzerlandSyriaTaiwanThailandTrinidad and TobagoTurkeyUgandaUkraineUruguayUzbekistanVenezuelaVietnamWest IndiesWestern AfricaWestern AsiaWestern EuropeYemenZaireZimbabweAzores
Immigrants from Australia
Race
Ancestry
AfghanAfricanAlaska NativeAlaskan AthabascanAlbanianAleutAlsatianAmericanApacheArabArapahoArgentineanArmenianAssyrian/Chaldean/SyriacAustralianAustrianBahamianBangladeshiBarbadianBasqueBelgianBelizeanBermudanBhutaneseBlackfeetBolivianBrazilianBritishBritish West IndianBulgarianBurmeseCajunCambodianCanadianCape VerdeanCarpatho RusynCelticCentral AmericanCentral American IndianCherokeeCheyenneChickasawChileanChineseChippewaChoctawColombianColvilleComancheCosta RicanCreeCreekCroatianCrowCubanCypriotCzechCzechoslovakianDanishDelawareDominicanDutchDutch West IndianEastern EuropeanEcuadorianEgyptianEnglishEstonianEthiopianEuropeanFijianFilipinoFinnishFrenchFrench American IndianFrench CanadianGermanGerman RussianGhanaianGreekGuamanian/ChamorroGuatemalanGuyaneseHaitianHmongHonduranHopiHoumaHungarianIcelanderIndian (Asian)IndonesianInupiatIranianIraqiIrishIroquoisIsraeliItalianJamaicanJapaneseJordanianKenyanKiowaKoreanLaotianLatvianLebaneseLiberianLithuanianLumbeeLuxembourgerMacedonianMalaysianMalteseMarshalleseMenomineeMexicanMexican American IndianMongolianMoroccanNative HawaiianNavajoNepaleseNew ZealanderNicaraguanNigerianNorthern EuropeanNorwegianOkinawanOsageOttawaPaiutePakistaniPalestinianPanamanianParaguayanPennsylvania GermanPeruvianPimaPolishPortuguesePotawatomiPuebloPuerto RicanPuget Sound SalishRomanianRussianSalvadoranSamoanScandinavianScotch-IrishScottishSeminoleSenegaleseSerbianShoshoneSierra LeoneanSiouxSlavicSlovakSloveneSomaliSouth AfricanSouth AmericanSouth American IndianSoviet UnionSpaniardSpanishSpanish AmericanSpanish American IndianSri LankanSubsaharan AfricanSudaneseSwedishSwissSyrianTaiwaneseThaiTlingit-HaidaTohono O'OdhamTonganTrinidadian and TobagonianTsimshianTurkishU.S. Virgin IslanderUgandanUkrainianUruguayanUteVenezuelanVietnameseWelshWest IndianYakamaYaquiYugoslavianYumanYup'ikZimbabwean
Immigration
NonimmigrantsImmigrantsAfghanistanAfricaAlbaniaArgentinaArmeniaAsiaAustraliaAustriaBahamasBangladeshBarbadosBelarusBelgiumBelizeBoliviaBosnia and HerzegovinaBrazilBulgariaBurma/MyanmarCabo VerdeCambodiaCameroonCanadaCaribbeanCentral AmericaChileChinaColombiaCongoCosta RicaCroatiaCubaCzechoslovakiaDenmarkDominicaDominican RepublicEastern AfricaEastern AsiaEastern EuropeEcuadorEgyptEl SalvadorEnglandEritreaEthiopiaEuropeFijiFranceGermanyGhanaGreeceGrenadaGuatemalaGuyanaHaitiHondurasHong KongHungaryIndiaIndonesiaIranIraqIrelandIsraelItalyJamaicaJapanJordanKazakhstanKenyaKoreaKuwaitLaosLatin AmericaLatviaLebanonLiberiaLithuaniaMalaysiaMexicoMicronesiaMiddle AfricaMoldovaMoroccoNepalNetherlandsNicaraguaNigeriaNorth AmericaNorth MacedoniaNorthern AfricaNorthern EuropeNorwayOceaniaPakistanPanamaPeruPhilippinesPolandPortugalRomaniaRussiaSaudi ArabiaScotlandSenegalSerbiaSierra LeoneSingaporeSomaliaSouth AfricaSouth AmericaSouth Central AsiaSouth Eastern AsiaSouthern EuropeSpainSri LankaSt. Vincent and the GrenadinesSudanSwedenSwitzerlandSyriaTaiwanThailandTrinidad and TobagoTurkeyUgandaUkraineUruguayUzbekistanVenezuelaVietnamWest IndiesWestern AfricaWestern AsiaWestern EuropeYemenZaireZimbabweAzores
Single Mother Poverty
Income
Poverty
Unemployment
Labor Participation
Family Structure
Vehicle Availability
Education Level
Disability

Single Mother Poverty Comparison

Natives/Alaskans

Immigrants from Australia

Tragic
Exceptional
36.6%
SINGLE MOTHER POVERTY
0.0/ 100
METRIC RATING
330th/ 347
METRIC RANK
27.3%
SINGLE MOTHER POVERTY
99.5/ 100
METRIC RATING
67th/ 347
METRIC RANK

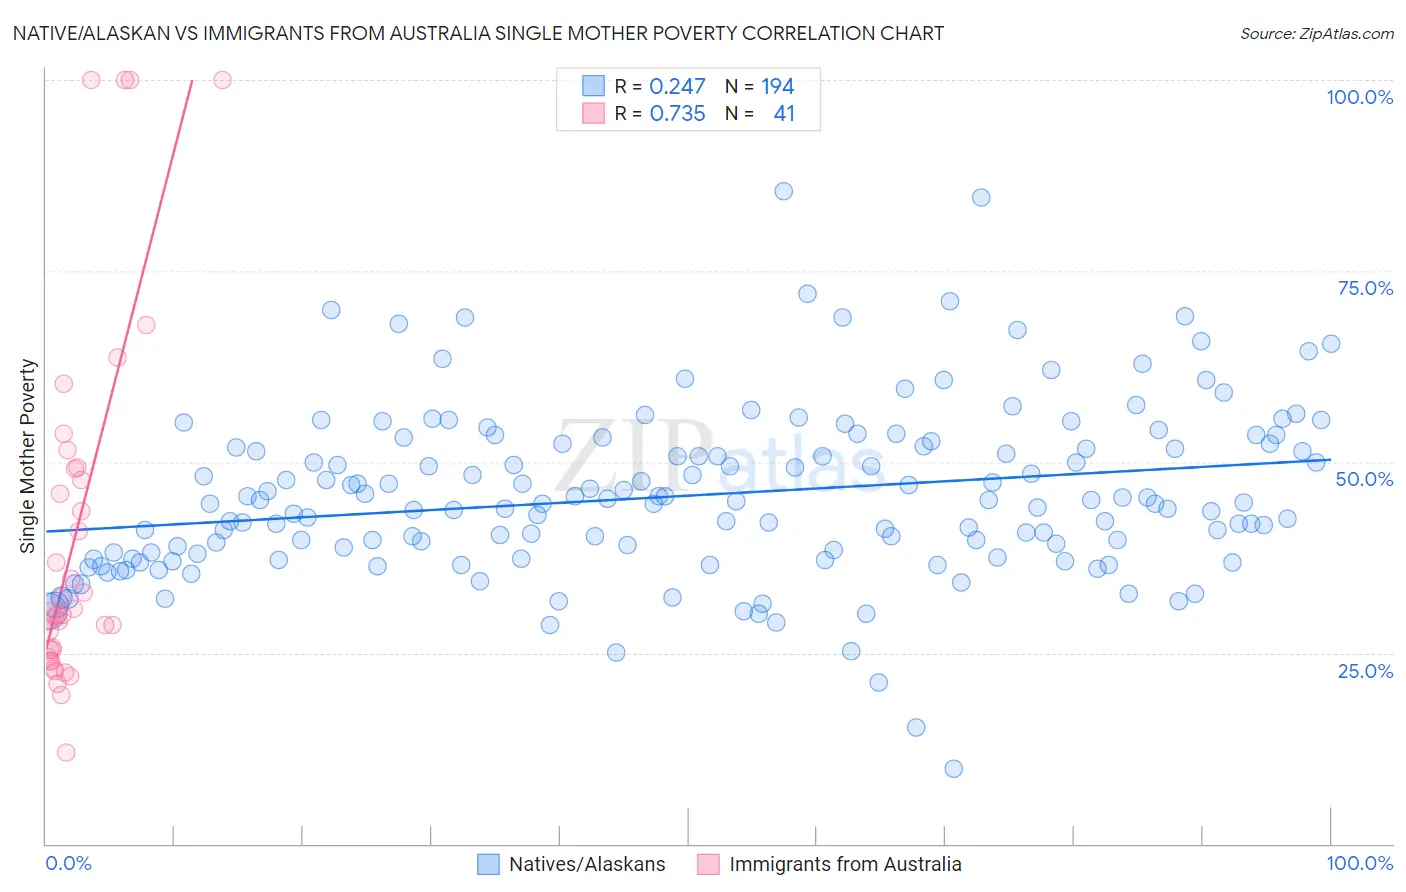
Native/Alaskan vs Immigrants from Australia Single Mother Poverty Correlation Chart

The statistical analysis conducted on geographies consisting of 497,815,701 people shows a weak positive correlation between the proportion of Natives/Alaskans and poverty level among single mothers in the United States with a correlation coefficient (R) of 0.247 and weighted average of 36.6%. Similarly, the statistical analysis conducted on geographies consisting of 222,815,185 people shows a strong positive correlation between the proportion of Immigrants from Australia and poverty level among single mothers in the United States with a correlation coefficient (R) of 0.735 and weighted average of 27.3%, a difference of 34.0%.
Native/Alaskan vs Immigrants from Australia Single Mother Poverty

Single Mother Poverty Correlation Summary

MeasurementNative/AlaskanImmigrants from Australia
Minimum9.8%11.9%
Maximum85.4%100.0%
Range75.6%88.1%
Mean45.6%40.6%
Median44.6%30.0%
Interquartile 25% (IQ1)37.9%24.9%
Interquartile 75% (IQ3)52.0%49.2%
Interquartile Range (IQR)14.1%24.3%
Standard Deviation (Sample)11.2%23.5%
Standard Deviation (Population)11.2%23.2%

Similar Demographics by Single Mother Poverty

Demographics Similar to Natives/Alaskans by Single Mother Poverty

In terms of single mother poverty, the demographic groups most similar to Natives/Alaskans are Apache (36.6%, a difference of 0.10%), Creek (36.7%, a difference of 0.16%), Dutch West Indian (36.8%, a difference of 0.40%), Choctaw (36.4%, a difference of 0.58%), and Yakama (36.4%, a difference of 0.64%).
DemographicsRating | RankSingle Mother Poverty
Kiowa
0.0
/100
|
#323
Tragic
35.5%
Ottawa
0.0
/100
|
#324
Tragic
35.5%
Ute
0.0
/100
|
#325
Tragic
35.7%
Seminole
0.0
/100
|
#326
Tragic
35.8%
Yakama
0.0
/100
|
#327
Tragic
36.4%
Choctaw
0.0
/100
|
#328
Tragic
36.4%
Apache
0.0
/100
|
#329
Tragic
36.6%
Natives/Alaskans
0.0
/100
|
#330
Tragic
36.6%
Creek
0.0
/100
|
#331
Tragic
36.7%
Dutch West Indians
0.0
/100
|
#332
Tragic
36.8%
Menominee
0.0
/100
|
#333
Tragic
37.1%
Pueblo
0.0
/100
|
#334
Tragic
37.2%
Yuman
0.0
/100
|
#335
Tragic
37.8%
Cheyenne
0.0
/100
|
#336
Tragic
38.5%
Immigrants | Yemen
0.0
/100
|
#337
Tragic
38.5%

Demographics Similar to Immigrants from Australia by Single Mother Poverty

In terms of single mother poverty, the demographic groups most similar to Immigrants from Australia are Soviet Union (27.3%, a difference of 0.020%), Immigrants from Czechoslovakia (27.4%, a difference of 0.030%), Immigrants from Turkey (27.3%, a difference of 0.060%), Russian (27.3%, a difference of 0.14%), and Immigrants from Northern Europe (27.3%, a difference of 0.17%).
DemographicsRating | RankSingle Mother Poverty
Eastern Europeans
99.6
/100
|
#60
Exceptional
27.2%
Immigrants | Eastern Europe
99.6
/100
|
#61
Exceptional
27.2%
Immigrants | Malaysia
99.5
/100
|
#62
Exceptional
27.3%
Immigrants | Northern Europe
99.5
/100
|
#63
Exceptional
27.3%
Russians
99.5
/100
|
#64
Exceptional
27.3%
Immigrants | Turkey
99.5
/100
|
#65
Exceptional
27.3%
Soviet Union
99.5
/100
|
#66
Exceptional
27.3%
Immigrants | Australia
99.5
/100
|
#67
Exceptional
27.3%
Immigrants | Czechoslovakia
99.5
/100
|
#68
Exceptional
27.4%
Lithuanians
99.4
/100
|
#69
Exceptional
27.4%
Immigrants | Belarus
99.4
/100
|
#70
Exceptional
27.4%
Macedonians
99.4
/100
|
#71
Exceptional
27.4%
Immigrants | Russia
99.4
/100
|
#72
Exceptional
27.4%
Sierra Leoneans
99.3
/100
|
#73
Exceptional
27.4%
Immigrants | Europe
99.3
/100
|
#74
Exceptional
27.4%