Menominee vs Immigrants from Northern Africa Poverty

COMPARE

Menominee
Race
Ancestry
AfghanAfricanAlaska NativeAlaskan AthabascanAlbanianAleutAlsatianAmericanApacheArabArapahoArgentineanArmenianAssyrian/Chaldean/SyriacAustralianAustrianBahamianBangladeshiBarbadianBasqueBelgianBelizeanBermudanBhutaneseBlackfeetBolivianBrazilianBritishBritish West IndianBulgarianBurmeseCajunCambodianCanadianCape VerdeanCarpatho RusynCelticCentral AmericanCentral American IndianCherokeeCheyenneChickasawChileanChineseChippewaChoctawColombianColvilleComancheCosta RicanCreeCreekCroatianCrowCubanCypriotCzechCzechoslovakianDanishDelawareDominicanDutchDutch West IndianEastern EuropeanEcuadorianEgyptianEnglishEstonianEthiopianEuropeanFijianFilipinoFinnishFrenchFrench American IndianFrench CanadianGermanGerman RussianGhanaianGreekGuamanian/ChamorroGuatemalanGuyaneseHaitianHmongHonduranHopiHoumaHungarianIcelanderIndian (Asian)IndonesianInupiatIranianIraqiIrishIroquoisIsraeliItalianJamaicanJapaneseJordanianKenyanKiowaKoreanLaotianLatvianLebaneseLiberianLithuanianLumbeeLuxembourgerMacedonianMalaysianMalteseMarshalleseMenomineeMexicanMexican American IndianMongolianMoroccanNative HawaiianNavajoNepaleseNew ZealanderNicaraguanNigerianNorthern EuropeanNorwegianOkinawanOsageOttawaPaiutePakistaniPalestinianPanamanianParaguayanPennsylvania GermanPeruvianPimaPolishPortuguesePotawatomiPuebloPuerto RicanPuget Sound SalishRomanianRussianSalvadoranSamoanScandinavianScotch-IrishScottishSeminoleSenegaleseSerbianShoshoneSierra LeoneanSiouxSlavicSlovakSloveneSomaliSouth AfricanSouth AmericanSouth American IndianSoviet UnionSpaniardSpanishSpanish AmericanSpanish American IndianSri LankanSubsaharan AfricanSudaneseSwedishSwissSyrianTaiwaneseThaiTlingit-HaidaTohono O'OdhamTonganTrinidadian and TobagonianTsimshianTurkishU.S. Virgin IslanderUgandanUkrainianUruguayanUteVenezuelanVietnameseWelshWest IndianYakamaYaquiYugoslavianYumanYup'ikZimbabwean
Immigration
NonimmigrantsImmigrantsAfghanistanAfricaAlbaniaArgentinaArmeniaAsiaAustraliaAustriaBahamasBangladeshBarbadosBelarusBelgiumBelizeBoliviaBosnia and HerzegovinaBrazilBulgariaBurma/MyanmarCabo VerdeCambodiaCameroonCanadaCaribbeanCentral AmericaChileChinaColombiaCongoCosta RicaCroatiaCubaCzechoslovakiaDenmarkDominicaDominican RepublicEastern AfricaEastern AsiaEastern EuropeEcuadorEgyptEl SalvadorEnglandEritreaEthiopiaEuropeFijiFranceGermanyGhanaGreeceGrenadaGuatemalaGuyanaHaitiHondurasHong KongHungaryIndiaIndonesiaIranIraqIrelandIsraelItalyJamaicaJapanJordanKazakhstanKenyaKoreaKuwaitLaosLatin AmericaLatviaLebanonLiberiaLithuaniaMalaysiaMexicoMicronesiaMiddle AfricaMoldovaMoroccoNepalNetherlandsNicaraguaNigeriaNorth AmericaNorth MacedoniaNorthern EuropeNorwayOceaniaPakistanPanamaPeruPhilippinesPolandPortugalRomaniaRussiaSaudi ArabiaScotlandSenegalSerbiaSierra LeoneSingaporeSomaliaSouth AfricaSouth AmericaSouth Central AsiaSouth Eastern AsiaSouthern EuropeSpainSri LankaSt. Vincent and the GrenadinesSudanSwedenSwitzerlandSyriaTaiwanThailandTrinidad and TobagoTurkeyUgandaUkraineUruguayUzbekistanVenezuelaVietnamWest IndiesWestern AfricaWestern AsiaWestern EuropeYemenZaireZimbabweAzores
Immigrants from Northern Africa
Race
Ancestry
AfghanAfricanAlaska NativeAlaskan AthabascanAlbanianAleutAlsatianAmericanApacheArabArapahoArgentineanArmenianAssyrian/Chaldean/SyriacAustralianAustrianBahamianBangladeshiBarbadianBasqueBelgianBelizeanBermudanBhutaneseBlackfeetBolivianBrazilianBritishBritish West IndianBulgarianBurmeseCajunCambodianCanadianCape VerdeanCarpatho RusynCelticCentral AmericanCentral American IndianCherokeeCheyenneChickasawChileanChineseChippewaChoctawColombianColvilleComancheCosta RicanCreeCreekCroatianCrowCubanCypriotCzechCzechoslovakianDanishDelawareDominicanDutchDutch West IndianEastern EuropeanEcuadorianEgyptianEnglishEstonianEthiopianEuropeanFijianFilipinoFinnishFrenchFrench American IndianFrench CanadianGermanGerman RussianGhanaianGreekGuamanian/ChamorroGuatemalanGuyaneseHaitianHmongHonduranHopiHoumaHungarianIcelanderIndian (Asian)IndonesianInupiatIranianIraqiIrishIroquoisIsraeliItalianJamaicanJapaneseJordanianKenyanKiowaKoreanLaotianLatvianLebaneseLiberianLithuanianLumbeeLuxembourgerMacedonianMalaysianMalteseMarshalleseMexicanMexican American IndianMongolianMoroccanNative HawaiianNavajoNepaleseNew ZealanderNicaraguanNigerianNorthern EuropeanNorwegianOkinawanOsageOttawaPaiutePakistaniPalestinianPanamanianParaguayanPennsylvania GermanPeruvianPimaPolishPortuguesePotawatomiPuebloPuerto RicanPuget Sound SalishRomanianRussianSalvadoranSamoanScandinavianScotch-IrishScottishSeminoleSenegaleseSerbianShoshoneSierra LeoneanSiouxSlavicSlovakSloveneSomaliSouth AfricanSouth AmericanSouth American IndianSoviet UnionSpaniardSpanishSpanish AmericanSpanish American IndianSri LankanSubsaharan AfricanSudaneseSwedishSwissSyrianTaiwaneseThaiTlingit-HaidaTohono O'OdhamTonganTrinidadian and TobagonianTsimshianTurkishU.S. Virgin IslanderUgandanUkrainianUruguayanUteVenezuelanVietnameseWelshWest IndianYakamaYaquiYugoslavianYumanYup'ikZimbabwean
Immigration
NonimmigrantsImmigrantsAfghanistanAfricaAlbaniaArgentinaArmeniaAsiaAustraliaAustriaBahamasBangladeshBarbadosBelarusBelgiumBelizeBoliviaBosnia and HerzegovinaBrazilBulgariaBurma/MyanmarCabo VerdeCambodiaCameroonCanadaCaribbeanCentral AmericaChileChinaColombiaCongoCosta RicaCroatiaCubaCzechoslovakiaDenmarkDominicaDominican RepublicEastern AfricaEastern AsiaEastern EuropeEcuadorEgyptEl SalvadorEnglandEritreaEthiopiaEuropeFijiFranceGermanyGhanaGreeceGrenadaGuatemalaGuyanaHaitiHondurasHong KongHungaryIndiaIndonesiaIranIraqIrelandIsraelItalyJamaicaJapanJordanKazakhstanKenyaKoreaKuwaitLaosLatin AmericaLatviaLebanonLiberiaLithuaniaMalaysiaMexicoMicronesiaMiddle AfricaMoldovaMoroccoNepalNetherlandsNicaraguaNigeriaNorth AmericaNorth MacedoniaNorthern AfricaNorthern EuropeNorwayOceaniaPakistanPanamaPeruPhilippinesPolandPortugalRomaniaRussiaSaudi ArabiaScotlandSenegalSerbiaSierra LeoneSingaporeSomaliaSouth AfricaSouth AmericaSouth Central AsiaSouth Eastern AsiaSouthern EuropeSpainSri LankaSt. Vincent and the GrenadinesSudanSwedenSwitzerlandSyriaTaiwanThailandTrinidad and TobagoTurkeyUgandaUkraineUruguayUzbekistanVenezuelaVietnamWest IndiesWestern AfricaWestern AsiaWestern EuropeYemenZaireZimbabweAzores
Poverty
Income
Poverty
Unemployment
Labor Participation
Family Structure
Vehicle Availability
Education Level
Disability

Poverty Comparison

Menominee

Immigrants from Northern Africa

Tragic
Good
16.4%
POVERTY
0.0/ 100
METRIC RATING
322nd/ 347
METRIC RANK
12.1%
POVERTY
63.9/ 100
METRIC RATING
153rd/ 347
METRIC RANK

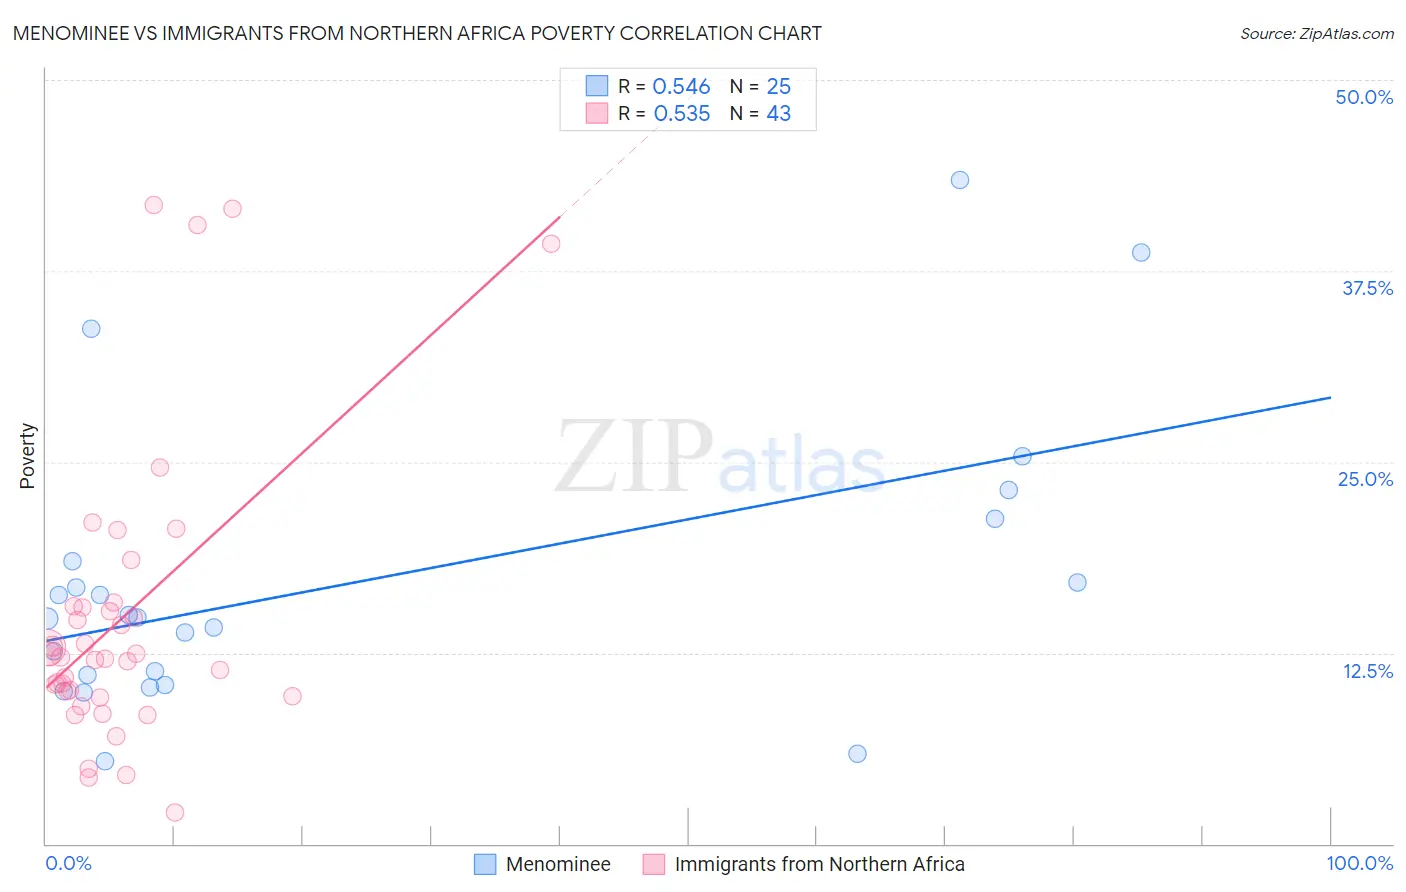
Menominee vs Immigrants from Northern Africa Poverty Correlation Chart

The statistical analysis conducted on geographies consisting of 45,777,730 people shows a substantial positive correlation between the proportion of Menominee and poverty level in the United States with a correlation coefficient (R) of 0.546 and weighted average of 16.4%. Similarly, the statistical analysis conducted on geographies consisting of 321,083,252 people shows a substantial positive correlation between the proportion of Immigrants from Northern Africa and poverty level in the United States with a correlation coefficient (R) of 0.535 and weighted average of 12.1%, a difference of 35.4%.
Menominee vs Immigrants from Northern Africa Poverty

Poverty Correlation Summary

MeasurementMenomineeImmigrants from Northern Africa
Minimum5.4%2.1%
Maximum43.5%41.8%
Range38.1%39.7%
Mean17.2%14.8%
Median14.8%12.2%
Interquartile 25% (IQ1)10.7%9.7%
Interquartile 75% (IQ3)19.9%15.6%
Interquartile Range (IQR)9.2%5.9%
Standard Deviation (Sample)9.5%9.6%
Standard Deviation (Population)9.3%9.5%

Similar Demographics by Poverty

Demographics Similar to Menominee by Poverty

In terms of poverty, the demographic groups most similar to Menominee are Colville (16.6%, a difference of 0.75%), Arapaho (16.3%, a difference of 0.96%), Yakama (16.7%, a difference of 1.3%), Central American Indian (16.7%, a difference of 1.5%), and Immigrants from Honduras (16.2%, a difference of 1.7%).
DemographicsRating | RankPoverty
British West Indians
0.0
/100
|
#315
Tragic
15.9%
Hondurans
0.0
/100
|
#316
Tragic
15.9%
U.S. Virgin Islanders
0.0
/100
|
#317
Tragic
16.1%
Immigrants | Dominica
0.0
/100
|
#318
Tragic
16.1%
Immigrants | Congo
0.0
/100
|
#319
Tragic
16.1%
Immigrants | Honduras
0.0
/100
|
#320
Tragic
16.2%
Arapaho
0.0
/100
|
#321
Tragic
16.3%
Menominee
0.0
/100
|
#322
Tragic
16.4%
Colville
0.0
/100
|
#323
Tragic
16.6%
Yakama
0.0
/100
|
#324
Tragic
16.7%
Central American Indians
0.0
/100
|
#325
Tragic
16.7%
Paiute
0.0
/100
|
#326
Tragic
16.7%
Kiowa
0.0
/100
|
#327
Tragic
16.8%
Ute
0.0
/100
|
#328
Tragic
16.9%
Blacks/African Americans
0.0
/100
|
#329
Tragic
17.3%

Demographics Similar to Immigrants from Northern Africa by Poverty

In terms of poverty, the demographic groups most similar to Immigrants from Northern Africa are Guamanian/Chamorro (12.1%, a difference of 0.010%), Hungarian (12.2%, a difference of 0.030%), Scotch-Irish (12.2%, a difference of 0.15%), Costa Rican (12.2%, a difference of 0.18%), and Taiwanese (12.2%, a difference of 0.22%).
DemographicsRating | RankPoverty
Afghans
74.9
/100
|
#146
Good
12.0%
Immigrants | Bosnia and Herzegovina
73.7
/100
|
#147
Good
12.0%
Immigrants | Germany
72.7
/100
|
#148
Good
12.0%
Immigrants | Malaysia
72.7
/100
|
#149
Good
12.0%
Immigrants | Kazakhstan
72.3
/100
|
#150
Good
12.0%
Samoans
71.9
/100
|
#151
Good
12.0%
Armenians
67.6
/100
|
#152
Good
12.1%
Immigrants | Northern Africa
63.9
/100
|
#153
Good
12.1%
Guamanians/Chamorros
63.9
/100
|
#154
Good
12.1%
Hungarians
63.6
/100
|
#155
Good
12.2%
Scotch-Irish
62.6
/100
|
#156
Good
12.2%
Costa Ricans
62.2
/100
|
#157
Good
12.2%
Taiwanese
61.8
/100
|
#158
Good
12.2%
Pennsylvania Germans
60.8
/100
|
#159
Good
12.2%
Immigrants | Nepal
60.4
/100
|
#160
Good
12.2%