Menominee vs Delaware Single Father Poverty
COMPARE
Menominee
Delaware
Single Father Poverty
Single Father Poverty Comparison
Menominee
Delaware
16.8%
SINGLE FATHER POVERTY
6.4/ 100
METRIC RATING
225th/ 347
METRIC RANK
18.9%
SINGLE FATHER POVERTY
0.0/ 100
METRIC RATING
314th/ 347
METRIC RANK
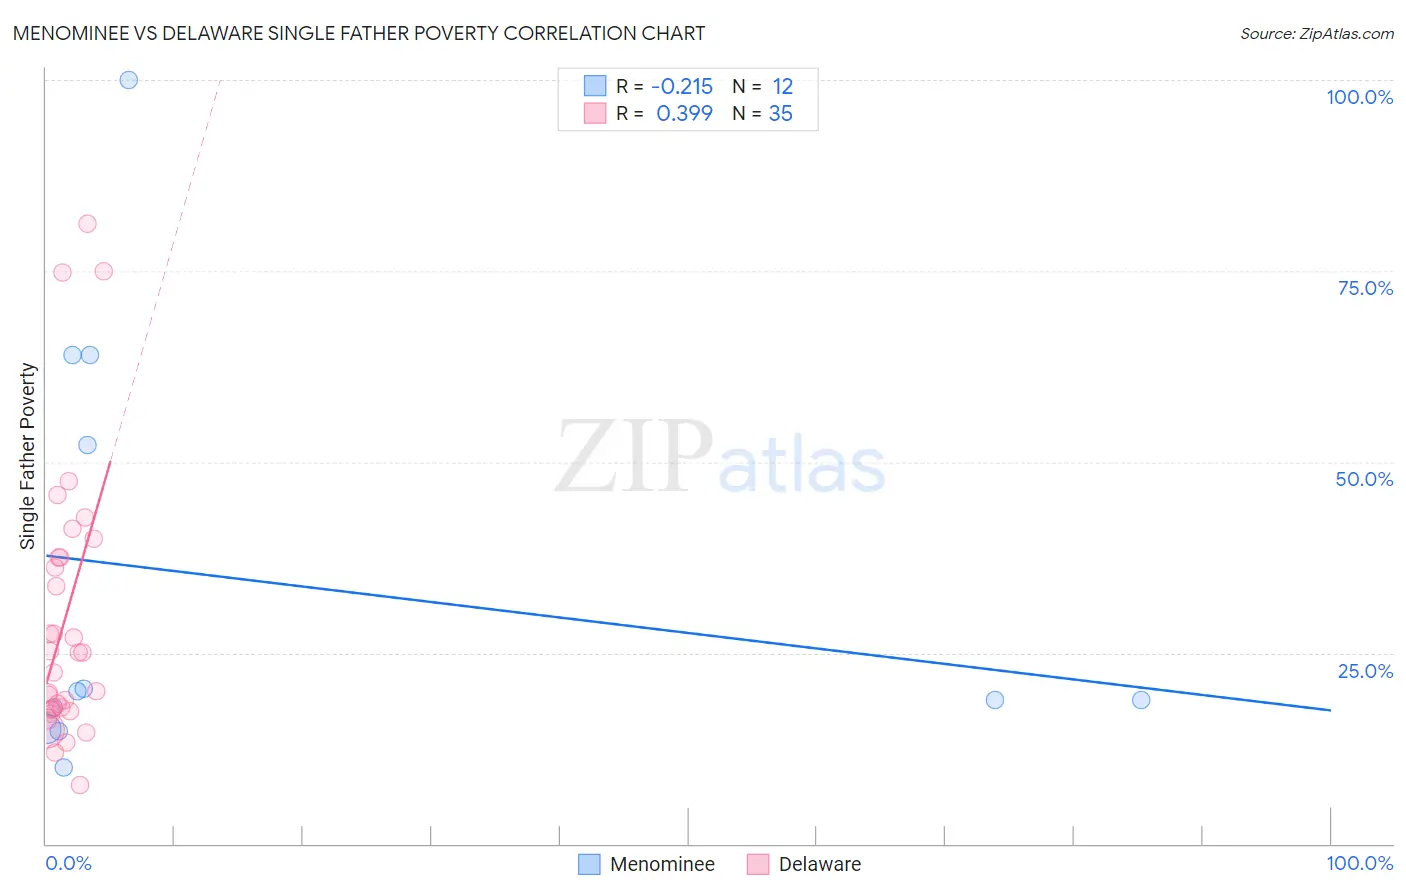
Menominee vs Delaware Single Father Poverty Correlation Chart
The statistical analysis conducted on geographies consisting of 42,801,282 people shows a weak negative correlation between the proportion of Menominee and poverty level among single fathers in the United States with a correlation coefficient (R) of -0.215 and weighted average of 16.8%. Similarly, the statistical analysis conducted on geographies consisting of 86,574,131 people shows a mild positive correlation between the proportion of Delaware and poverty level among single fathers in the United States with a correlation coefficient (R) of 0.399 and weighted average of 18.9%, a difference of 12.8%.
Single Father Poverty Correlation Summary
| Measurement | Menominee | Delaware |
| Minimum | 9.9% | 7.7% |
| Maximum | 100.0% | 81.2% |
| Range | 90.1% | 73.6% |
| Mean | 34.6% | 29.6% |
| Median | 19.4% | 25.0% |
| Interquartile 25% (IQ1) | 16.4% | 17.5% |
| Interquartile 75% (IQ3) | 58.1% | 37.5% |
| Interquartile Range (IQR) | 41.7% | 20.1% |
| Standard Deviation (Sample) | 28.5% | 18.0% |
| Standard Deviation (Population) | 27.2% | 17.7% |
Similar Demographics by Single Father Poverty
Demographics Similar to Menominee by Single Father Poverty
In terms of single father poverty, the demographic groups most similar to Menominee are Immigrants from Norway (16.8%, a difference of 0.020%), Hispanic or Latino (16.8%, a difference of 0.050%), Immigrants from Austria (16.8%, a difference of 0.10%), British (16.8%, a difference of 0.15%), and Belgian (16.8%, a difference of 0.21%).
| Demographics | Rating | Rank | Single Father Poverty |
| Immigrants | Uganda | 8.6 /100 | #218 | Tragic 16.7% |
| Immigrants | Ghana | 8.1 /100 | #219 | Tragic 16.7% |
| Immigrants | Denmark | 8.1 /100 | #220 | Tragic 16.7% |
| Immigrants | Greece | 8.1 /100 | #221 | Tragic 16.7% |
| Immigrants | Spain | 8.0 /100 | #222 | Tragic 16.7% |
| Immigrants | Austria | 7.0 /100 | #223 | Tragic 16.8% |
| Immigrants | Norway | 6.5 /100 | #224 | Tragic 16.8% |
| Menominee | 6.4 /100 | #225 | Tragic 16.8% |
| Hispanics or Latinos | 6.1 /100 | #226 | Tragic 16.8% |
| British | 5.6 /100 | #227 | Tragic 16.8% |
| Belgians | 5.3 /100 | #228 | Tragic 16.8% |
| Israelis | 4.6 /100 | #229 | Tragic 16.8% |
| Immigrants | Trinidad and Tobago | 4.5 /100 | #230 | Tragic 16.8% |
| Spanish Americans | 3.7 /100 | #231 | Tragic 16.9% |
| Immigrants | Grenada | 3.7 /100 | #232 | Tragic 16.9% |
Demographics Similar to Delaware by Single Father Poverty
In terms of single father poverty, the demographic groups most similar to Delaware are Potawatomi (18.9%, a difference of 0.16%), Chickasaw (19.0%, a difference of 0.16%), Immigrants from Dominica (18.9%, a difference of 0.36%), Nonimmigrants (18.8%, a difference of 0.42%), and Osage (19.0%, a difference of 0.56%).
| Demographics | Rating | Rank | Single Father Poverty |
| French Canadians | 0.0 /100 | #307 | Tragic 18.6% |
| Ottawa | 0.0 /100 | #308 | Tragic 18.6% |
| Immigrants | Micronesia | 0.0 /100 | #309 | Tragic 18.6% |
| Chippewa | 0.0 /100 | #310 | Tragic 18.8% |
| Immigrants | Nonimmigrants | 0.0 /100 | #311 | Tragic 18.8% |
| Immigrants | Dominica | 0.0 /100 | #312 | Tragic 18.9% |
| Potawatomi | 0.0 /100 | #313 | Tragic 18.9% |
| Delaware | 0.0 /100 | #314 | Tragic 18.9% |
| Chickasaw | 0.0 /100 | #315 | Tragic 19.0% |
| Osage | 0.0 /100 | #316 | Tragic 19.0% |
| Dominicans | 0.0 /100 | #317 | Tragic 19.1% |
| Dutch West Indians | 0.0 /100 | #318 | Tragic 19.2% |
| Slovaks | 0.0 /100 | #319 | Tragic 19.3% |
| Inupiat | 0.0 /100 | #320 | Tragic 19.5% |
| Cherokee | 0.0 /100 | #321 | Tragic 19.6% |