Immigrants from West Indies vs Delaware Single Father Poverty
COMPARE
Immigrants from West Indies
Delaware
Single Father Poverty
Single Father Poverty Comparison
Immigrants from West Indies
Delaware
15.9%
SINGLE FATHER POVERTY
90.8/ 100
METRIC RATING
129th/ 347
METRIC RANK
18.9%
SINGLE FATHER POVERTY
0.0/ 100
METRIC RATING
314th/ 347
METRIC RANK
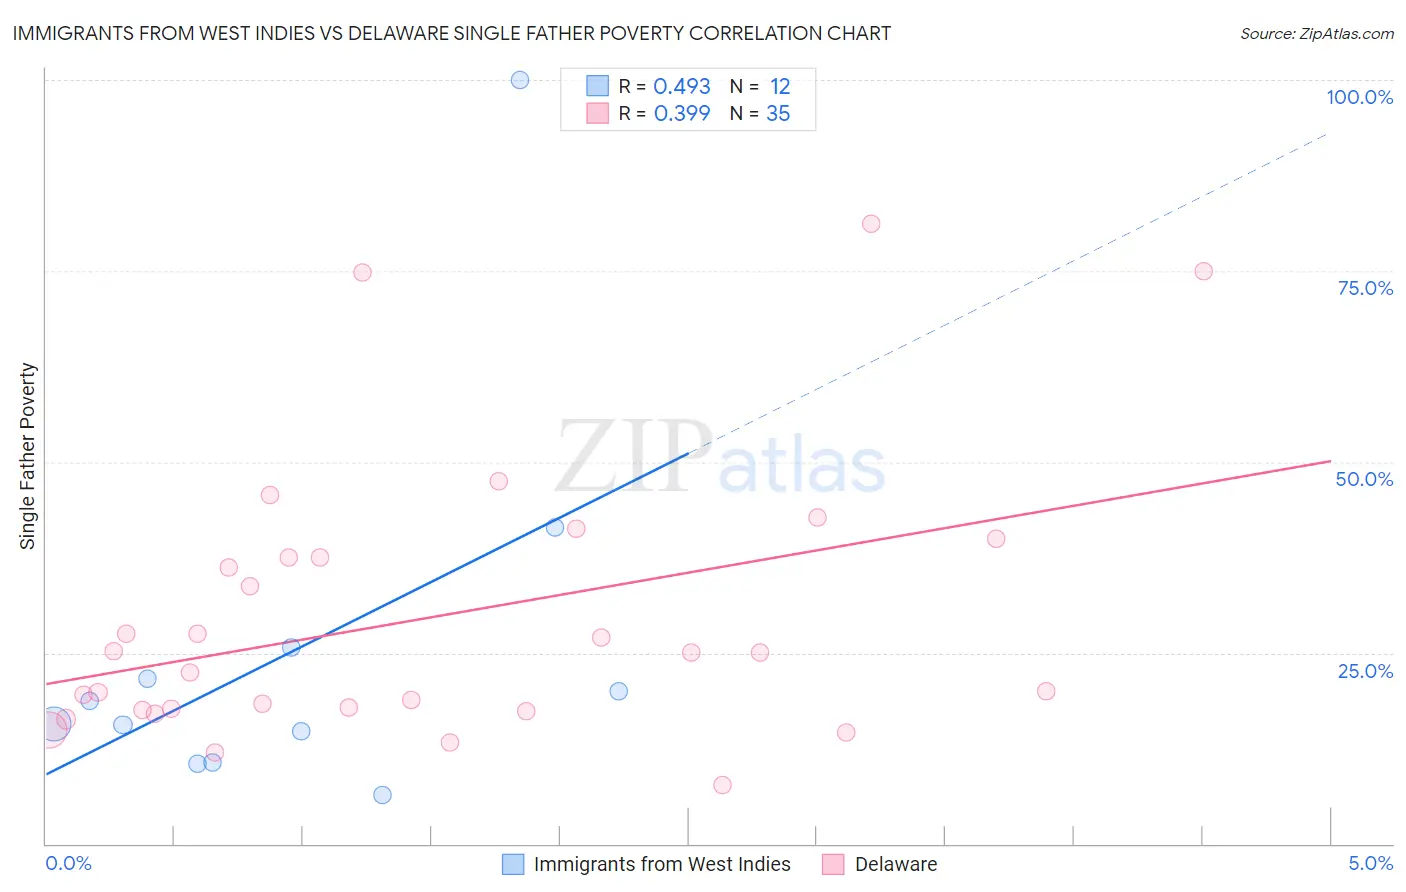
Immigrants from West Indies vs Delaware Single Father Poverty Correlation Chart
The statistical analysis conducted on geographies consisting of 68,386,268 people shows a moderate positive correlation between the proportion of Immigrants from West Indies and poverty level among single fathers in the United States with a correlation coefficient (R) of 0.493 and weighted average of 15.9%. Similarly, the statistical analysis conducted on geographies consisting of 86,574,131 people shows a mild positive correlation between the proportion of Delaware and poverty level among single fathers in the United States with a correlation coefficient (R) of 0.399 and weighted average of 18.9%, a difference of 19.1%.
Single Father Poverty Correlation Summary
| Measurement | Immigrants from West Indies | Delaware |
| Minimum | 6.4% | 7.7% |
| Maximum | 100.0% | 81.2% |
| Range | 93.6% | 73.6% |
| Mean | 25.1% | 29.6% |
| Median | 17.2% | 25.0% |
| Interquartile 25% (IQ1) | 12.7% | 17.5% |
| Interquartile 75% (IQ3) | 23.7% | 37.5% |
| Interquartile Range (IQR) | 11.0% | 20.1% |
| Standard Deviation (Sample) | 25.3% | 18.0% |
| Standard Deviation (Population) | 24.2% | 17.7% |
Similar Demographics by Single Father Poverty
Demographics Similar to Immigrants from West Indies by Single Father Poverty
In terms of single father poverty, the demographic groups most similar to Immigrants from West Indies are Immigrants from Nigeria (15.9%, a difference of 0.0%), Immigrants from Liberia (15.9%, a difference of 0.040%), Hmong (15.9%, a difference of 0.050%), Iraqi (15.9%, a difference of 0.060%), and Palestinian (15.9%, a difference of 0.070%).
| Demographics | Rating | Rank | Single Father Poverty |
| Sudanese | 91.6 /100 | #122 | Exceptional 15.9% |
| Palestinians | 91.3 /100 | #123 | Exceptional 15.9% |
| Immigrants | Panama | 91.3 /100 | #124 | Exceptional 15.9% |
| Iraqis | 91.2 /100 | #125 | Exceptional 15.9% |
| Hmong | 91.1 /100 | #126 | Exceptional 15.9% |
| Immigrants | Liberia | 91.1 /100 | #127 | Exceptional 15.9% |
| Immigrants | Nigeria | 90.8 /100 | #128 | Exceptional 15.9% |
| Immigrants | West Indies | 90.8 /100 | #129 | Exceptional 15.9% |
| Norwegians | 90.2 /100 | #130 | Exceptional 15.9% |
| Nicaraguans | 90.1 /100 | #131 | Exceptional 15.9% |
| Immigrants | Portugal | 89.7 /100 | #132 | Excellent 15.9% |
| Immigrants | Syria | 89.5 /100 | #133 | Excellent 15.9% |
| Immigrants | South America | 88.5 /100 | #134 | Excellent 15.9% |
| Immigrants | Sri Lanka | 88.2 /100 | #135 | Excellent 15.9% |
| Cypriots | 87.5 /100 | #136 | Excellent 15.9% |
Demographics Similar to Delaware by Single Father Poverty
In terms of single father poverty, the demographic groups most similar to Delaware are Potawatomi (18.9%, a difference of 0.16%), Chickasaw (19.0%, a difference of 0.16%), Immigrants from Dominica (18.9%, a difference of 0.36%), Nonimmigrants (18.8%, a difference of 0.42%), and Osage (19.0%, a difference of 0.56%).
| Demographics | Rating | Rank | Single Father Poverty |
| French Canadians | 0.0 /100 | #307 | Tragic 18.6% |
| Ottawa | 0.0 /100 | #308 | Tragic 18.6% |
| Immigrants | Micronesia | 0.0 /100 | #309 | Tragic 18.6% |
| Chippewa | 0.0 /100 | #310 | Tragic 18.8% |
| Immigrants | Nonimmigrants | 0.0 /100 | #311 | Tragic 18.8% |
| Immigrants | Dominica | 0.0 /100 | #312 | Tragic 18.9% |
| Potawatomi | 0.0 /100 | #313 | Tragic 18.9% |
| Delaware | 0.0 /100 | #314 | Tragic 18.9% |
| Chickasaw | 0.0 /100 | #315 | Tragic 19.0% |
| Osage | 0.0 /100 | #316 | Tragic 19.0% |
| Dominicans | 0.0 /100 | #317 | Tragic 19.1% |
| Dutch West Indians | 0.0 /100 | #318 | Tragic 19.2% |
| Slovaks | 0.0 /100 | #319 | Tragic 19.3% |
| Inupiat | 0.0 /100 | #320 | Tragic 19.5% |
| Cherokee | 0.0 /100 | #321 | Tragic 19.6% |