Marshallese vs Immigrants from South Central Asia Family Poverty

COMPARE

Marshallese
Race
Ancestry
AfghanAfricanAlaska NativeAlaskan AthabascanAlbanianAleutAlsatianAmericanApacheArabArapahoArgentineanArmenianAssyrian/Chaldean/SyriacAustralianAustrianBahamianBangladeshiBarbadianBasqueBelgianBelizeanBermudanBhutaneseBlackfeetBolivianBrazilianBritishBritish West IndianBulgarianBurmeseCajunCambodianCanadianCape VerdeanCarpatho RusynCelticCentral AmericanCentral American IndianCherokeeCheyenneChickasawChileanChineseChippewaChoctawColombianColvilleComancheCosta RicanCreeCreekCroatianCrowCubanCypriotCzechCzechoslovakianDanishDelawareDominicanDutchDutch West IndianEastern EuropeanEcuadorianEgyptianEnglishEstonianEthiopianEuropeanFijianFilipinoFinnishFrenchFrench American IndianFrench CanadianGermanGerman RussianGhanaianGreekGuamanian/ChamorroGuatemalanGuyaneseHaitianHmongHonduranHopiHoumaHungarianIcelanderIndian (Asian)IndonesianInupiatIranianIraqiIrishIroquoisIsraeliItalianJamaicanJapaneseJordanianKenyanKiowaKoreanLaotianLatvianLebaneseLiberianLithuanianLumbeeLuxembourgerMacedonianMalaysianMalteseMarshalleseMenomineeMexicanMexican American IndianMongolianMoroccanNative HawaiianNavajoNepaleseNew ZealanderNicaraguanNigerianNorthern EuropeanNorwegianOkinawanOsageOttawaPaiutePakistaniPalestinianPanamanianParaguayanPennsylvania GermanPeruvianPimaPolishPortuguesePotawatomiPuebloPuerto RicanPuget Sound SalishRomanianRussianSalvadoranSamoanScandinavianScotch-IrishScottishSeminoleSenegaleseSerbianShoshoneSierra LeoneanSiouxSlavicSlovakSloveneSomaliSouth AfricanSouth AmericanSouth American IndianSoviet UnionSpaniardSpanishSpanish AmericanSpanish American IndianSri LankanSubsaharan AfricanSudaneseSwedishSwissSyrianTaiwaneseThaiTlingit-HaidaTohono O'OdhamTonganTrinidadian and TobagonianTsimshianTurkishU.S. Virgin IslanderUgandanUkrainianUruguayanUteVenezuelanVietnameseWelshWest IndianYakamaYaquiYugoslavianYumanYup'ikZimbabwean
Immigration
NonimmigrantsImmigrantsAfghanistanAfricaAlbaniaArgentinaArmeniaAsiaAustraliaAustriaBahamasBangladeshBarbadosBelarusBelgiumBelizeBoliviaBosnia and HerzegovinaBrazilBulgariaBurma/MyanmarCabo VerdeCambodiaCameroonCanadaCaribbeanCentral AmericaChileChinaColombiaCongoCosta RicaCroatiaCubaCzechoslovakiaDenmarkDominicaDominican RepublicEastern AfricaEastern AsiaEastern EuropeEcuadorEgyptEl SalvadorEnglandEritreaEthiopiaEuropeFijiFranceGermanyGhanaGreeceGrenadaGuatemalaGuyanaHaitiHondurasHong KongHungaryIndiaIndonesiaIranIraqIrelandIsraelItalyJamaicaJapanJordanKazakhstanKenyaKoreaKuwaitLaosLatin AmericaLatviaLebanonLiberiaLithuaniaMalaysiaMexicoMicronesiaMiddle AfricaMoldovaMoroccoNepalNetherlandsNicaraguaNigeriaNorth AmericaNorth MacedoniaNorthern AfricaNorthern EuropeNorwayOceaniaPakistanPanamaPeruPhilippinesPolandPortugalRomaniaRussiaSaudi ArabiaScotlandSenegalSerbiaSierra LeoneSingaporeSomaliaSouth AfricaSouth AmericaSouth Eastern AsiaSouthern EuropeSpainSri LankaSt. Vincent and the GrenadinesSudanSwedenSwitzerlandSyriaTaiwanThailandTrinidad and TobagoTurkeyUgandaUkraineUruguayUzbekistanVenezuelaVietnamWest IndiesWestern AfricaWestern AsiaWestern EuropeYemenZaireZimbabweAzores
Immigrants from South Central Asia
Race
Ancestry
AfghanAfricanAlaska NativeAlaskan AthabascanAlbanianAleutAlsatianAmericanApacheArabArapahoArgentineanArmenianAssyrian/Chaldean/SyriacAustralianAustrianBahamianBangladeshiBarbadianBasqueBelgianBelizeanBermudanBhutaneseBlackfeetBolivianBrazilianBritishBritish West IndianBulgarianBurmeseCajunCambodianCanadianCape VerdeanCarpatho RusynCelticCentral AmericanCentral American IndianCherokeeCheyenneChickasawChileanChineseChippewaChoctawColombianColvilleComancheCosta RicanCreeCreekCroatianCrowCubanCypriotCzechCzechoslovakianDanishDelawareDominicanDutchDutch West IndianEastern EuropeanEcuadorianEgyptianEnglishEstonianEthiopianEuropeanFijianFilipinoFinnishFrenchFrench American IndianFrench CanadianGermanGerman RussianGhanaianGreekGuamanian/ChamorroGuatemalanGuyaneseHaitianHmongHonduranHopiHoumaHungarianIcelanderIndian (Asian)IndonesianInupiatIranianIraqiIrishIroquoisIsraeliItalianJamaicanJapaneseJordanianKenyanKiowaKoreanLaotianLatvianLebaneseLiberianLithuanianLumbeeLuxembourgerMacedonianMalaysianMalteseMenomineeMexicanMexican American IndianMongolianMoroccanNative HawaiianNavajoNepaleseNew ZealanderNicaraguanNigerianNorthern EuropeanNorwegianOkinawanOsageOttawaPaiutePakistaniPalestinianPanamanianParaguayanPennsylvania GermanPeruvianPimaPolishPortuguesePotawatomiPuebloPuerto RicanPuget Sound SalishRomanianRussianSalvadoranSamoanScandinavianScotch-IrishScottishSeminoleSenegaleseSerbianShoshoneSierra LeoneanSiouxSlavicSlovakSloveneSomaliSouth AfricanSouth AmericanSouth American IndianSoviet UnionSpaniardSpanishSpanish AmericanSpanish American IndianSri LankanSubsaharan AfricanSudaneseSwedishSwissSyrianTaiwaneseThaiTlingit-HaidaTohono O'OdhamTonganTrinidadian and TobagonianTsimshianTurkishU.S. Virgin IslanderUgandanUkrainianUruguayanUteVenezuelanVietnameseWelshWest IndianYakamaYaquiYugoslavianYumanYup'ikZimbabwean
Immigration
NonimmigrantsImmigrantsAfghanistanAfricaAlbaniaArgentinaArmeniaAsiaAustraliaAustriaBahamasBangladeshBarbadosBelarusBelgiumBelizeBoliviaBosnia and HerzegovinaBrazilBulgariaBurma/MyanmarCabo VerdeCambodiaCameroonCanadaCaribbeanCentral AmericaChileChinaColombiaCongoCosta RicaCroatiaCubaCzechoslovakiaDenmarkDominicaDominican RepublicEastern AfricaEastern AsiaEastern EuropeEcuadorEgyptEl SalvadorEnglandEritreaEthiopiaEuropeFijiFranceGermanyGhanaGreeceGrenadaGuatemalaGuyanaHaitiHondurasHong KongHungaryIndiaIndonesiaIranIraqIrelandIsraelItalyJamaicaJapanJordanKazakhstanKenyaKoreaKuwaitLaosLatin AmericaLatviaLebanonLiberiaLithuaniaMalaysiaMexicoMicronesiaMiddle AfricaMoldovaMoroccoNepalNetherlandsNicaraguaNigeriaNorth AmericaNorth MacedoniaNorthern AfricaNorthern EuropeNorwayOceaniaPakistanPanamaPeruPhilippinesPolandPortugalRomaniaRussiaSaudi ArabiaScotlandSenegalSerbiaSierra LeoneSingaporeSomaliaSouth AfricaSouth AmericaSouth Central AsiaSouth Eastern AsiaSouthern EuropeSpainSri LankaSt. Vincent and the GrenadinesSudanSwedenSwitzerlandSyriaTaiwanThailandTrinidad and TobagoTurkeyUgandaUkraineUruguayUzbekistanVenezuelaVietnamWest IndiesWestern AfricaWestern AsiaWestern EuropeYemenZaireZimbabweAzores
Family Poverty
Income
Poverty
Unemployment
Labor Participation
Family Structure
Vehicle Availability
Education Level
Disability

Family Poverty Comparison

Marshallese

Immigrants from South Central Asia

Tragic
Exceptional
9.9%
FAMILY POVERTY
3.9/ 100
METRIC RATING
224th/ 347
METRIC RANK
7.2%
FAMILY POVERTY
99.8/ 100
METRIC RATING
16th/ 347
METRIC RANK

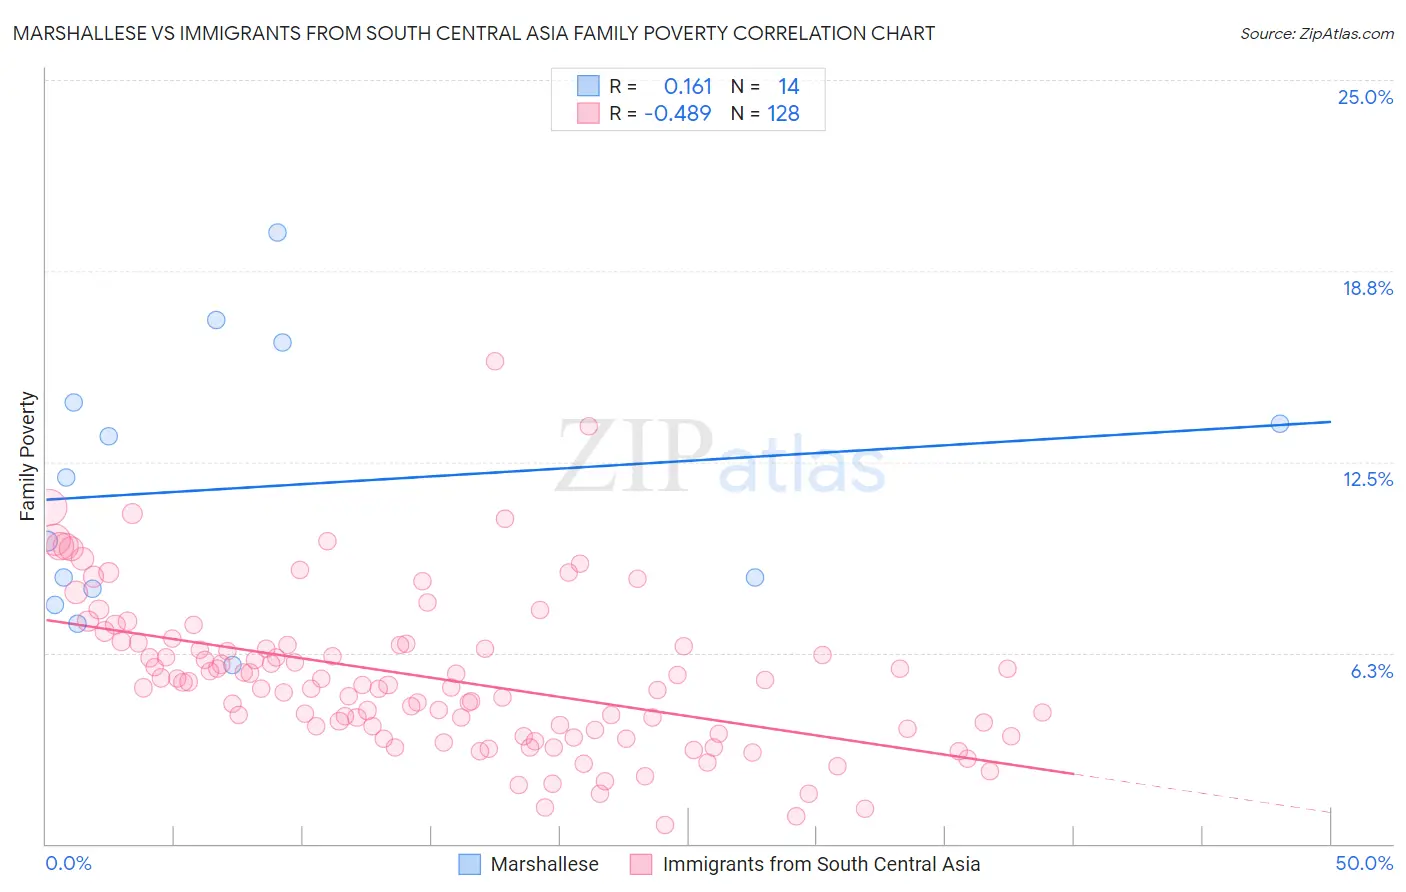
Marshallese vs Immigrants from South Central Asia Family Poverty Correlation Chart

The statistical analysis conducted on geographies consisting of 14,754,460 people shows a poor positive correlation between the proportion of Marshallese and poverty level among families in the United States with a correlation coefficient (R) of 0.161 and weighted average of 9.9%. Similarly, the statistical analysis conducted on geographies consisting of 471,025,257 people shows a moderate negative correlation between the proportion of Immigrants from South Central Asia and poverty level among families in the United States with a correlation coefficient (R) of -0.489 and weighted average of 7.2%, a difference of 38.1%.
Marshallese vs Immigrants from South Central Asia Family Poverty

Family Poverty Correlation Summary

MeasurementMarshalleseImmigrants from South Central Asia
Minimum5.8%0.60%
Maximum20.0%15.8%
Range14.2%15.2%
Mean11.7%5.4%
Median10.9%5.2%
Interquartile 25% (IQ1)8.3%3.7%
Interquartile 75% (IQ3)14.5%6.5%
Interquartile Range (IQR)6.1%2.9%
Standard Deviation (Sample)4.3%2.5%
Standard Deviation (Population)4.1%2.5%

Similar Demographics by Family Poverty

Demographics Similar to Marshallese by Family Poverty

In terms of family poverty, the demographic groups most similar to Marshallese are Immigrants (10.0%, a difference of 0.25%), Immigrants from Africa (9.9%, a difference of 0.30%), Ottawa (10.0%, a difference of 0.52%), Immigrants from Armenia (10.0%, a difference of 0.54%), and Japanese (9.9%, a difference of 0.60%).
DemographicsRating | RankFamily Poverty
Americans
6.2
/100
|
#217
Tragic
9.8%
Panamanians
5.6
/100
|
#218
Tragic
9.8%
Immigrants | Eritrea
5.4
/100
|
#219
Tragic
9.9%
Bermudans
5.3
/100
|
#220
Tragic
9.9%
Immigrants | Cambodia
4.8
/100
|
#221
Tragic
9.9%
Japanese
4.8
/100
|
#222
Tragic
9.9%
Immigrants | Africa
4.3
/100
|
#223
Tragic
9.9%
Marshallese
3.9
/100
|
#224
Tragic
9.9%
Immigrants | Immigrants
3.6
/100
|
#225
Tragic
10.0%
Ottawa
3.3
/100
|
#226
Tragic
10.0%
Immigrants | Armenia
3.3
/100
|
#227
Tragic
10.0%
Sudanese
3.1
/100
|
#228
Tragic
10.0%
Immigrants | Uzbekistan
3.1
/100
|
#229
Tragic
10.0%
Immigrants | Panama
3.1
/100
|
#230
Tragic
10.0%
Alaskan Athabascans
2.7
/100
|
#231
Tragic
10.1%

Demographics Similar to Immigrants from South Central Asia by Family Poverty

In terms of family poverty, the demographic groups most similar to Immigrants from South Central Asia are Luxembourger (7.2%, a difference of 0.22%), Immigrants from Lithuania (7.2%, a difference of 0.24%), Lithuanian (7.2%, a difference of 0.27%), Eastern European (7.2%, a difference of 0.54%), and Immigrants from Hong Kong (7.3%, a difference of 0.70%).
DemographicsRating | RankFamily Poverty
Latvians
99.9
/100
|
#9
Exceptional
7.1%
Bulgarians
99.8
/100
|
#10
Exceptional
7.1%
Immigrants | Singapore
99.8
/100
|
#11
Exceptional
7.1%
Maltese
99.8
/100
|
#12
Exceptional
7.1%
Swedes
99.8
/100
|
#13
Exceptional
7.1%
Iranians
99.8
/100
|
#14
Exceptional
7.1%
Lithuanians
99.8
/100
|
#15
Exceptional
7.2%
Immigrants | South Central Asia
99.8
/100
|
#16
Exceptional
7.2%
Luxembourgers
99.8
/100
|
#17
Exceptional
7.2%
Immigrants | Lithuania
99.8
/100
|
#18
Exceptional
7.2%
Eastern Europeans
99.7
/100
|
#19
Exceptional
7.2%
Immigrants | Hong Kong
99.7
/100
|
#20
Exceptional
7.3%
Immigrants | Iran
99.7
/100
|
#21
Exceptional
7.3%
Danes
99.7
/100
|
#22
Exceptional
7.3%
Assyrians/Chaldeans/Syriacs
99.7
/100
|
#23
Exceptional
7.3%