Marshallese vs Choctaw Child Poverty Among Boys Under 16

COMPARE

Marshallese
Race
Ancestry
AfghanAfricanAlaska NativeAlaskan AthabascanAlbanianAleutAlsatianAmericanApacheArabArapahoArgentineanArmenianAssyrian/Chaldean/SyriacAustralianAustrianBahamianBangladeshiBarbadianBasqueBelgianBelizeanBermudanBhutaneseBlackfeetBolivianBrazilianBritishBritish West IndianBulgarianBurmeseCajunCambodianCanadianCape VerdeanCarpatho RusynCelticCentral AmericanCentral American IndianCherokeeCheyenneChickasawChileanChineseChippewaColombianColvilleComancheCosta RicanCreeCreekCroatianCrowCubanCypriotCzechCzechoslovakianDanishDelawareDominicanDutchDutch West IndianEastern EuropeanEcuadorianEgyptianEnglishEstonianEthiopianEuropeanFijianFilipinoFinnishFrenchFrench American IndianFrench CanadianGermanGerman RussianGhanaianGreekGuamanian/ChamorroGuatemalanGuyaneseHaitianHmongHonduranHopiHoumaHungarianIcelanderIndian (Asian)IndonesianInupiatIranianIraqiIrishIroquoisIsraeliItalianJamaicanJapaneseJordanianKenyanKiowaKoreanLaotianLatvianLebaneseLiberianLithuanianLumbeeLuxembourgerMacedonianMalaysianMalteseMarshalleseMenomineeMexicanMexican American IndianMongolianMoroccanNative HawaiianNavajoNepaleseNew ZealanderNicaraguanNigerianNorthern EuropeanNorwegianOkinawanOsageOttawaPaiutePakistaniPalestinianPanamanianParaguayanPennsylvania GermanPeruvianPimaPolishPortuguesePotawatomiPuebloPuerto RicanPuget Sound SalishRomanianRussianSalvadoranSamoanScandinavianScotch-IrishScottishSeminoleSenegaleseSerbianShoshoneSierra LeoneanSiouxSlavicSlovakSloveneSomaliSouth AfricanSouth AmericanSouth American IndianSoviet UnionSpaniardSpanishSpanish AmericanSpanish American IndianSri LankanSubsaharan AfricanSudaneseSwedishSwissSyrianTaiwaneseThaiTlingit-HaidaTohono O'OdhamTonganTrinidadian and TobagonianTsimshianTurkishU.S. Virgin IslanderUgandanUkrainianUruguayanUteVenezuelanVietnameseWelshWest IndianYakamaYaquiYugoslavianYumanYup'ikZimbabwean
Immigration
NonimmigrantsImmigrantsAfghanistanAfricaAlbaniaArgentinaArmeniaAsiaAustraliaAustriaBahamasBangladeshBarbadosBelarusBelgiumBelizeBoliviaBosnia and HerzegovinaBrazilBulgariaBurma/MyanmarCabo VerdeCambodiaCameroonCanadaCaribbeanCentral AmericaChileChinaColombiaCongoCosta RicaCroatiaCubaCzechoslovakiaDenmarkDominicaDominican RepublicEastern AfricaEastern AsiaEastern EuropeEcuadorEgyptEl SalvadorEnglandEritreaEthiopiaEuropeFijiFranceGermanyGhanaGreeceGrenadaGuatemalaGuyanaHaitiHondurasHong KongHungaryIndiaIndonesiaIranIraqIrelandIsraelItalyJamaicaJapanJordanKazakhstanKenyaKoreaKuwaitLaosLatin AmericaLatviaLebanonLiberiaLithuaniaMalaysiaMexicoMicronesiaMiddle AfricaMoldovaMoroccoNepalNetherlandsNicaraguaNigeriaNorth AmericaNorth MacedoniaNorthern AfricaNorthern EuropeNorwayOceaniaPakistanPanamaPeruPhilippinesPolandPortugalRomaniaRussiaSaudi ArabiaScotlandSenegalSerbiaSierra LeoneSingaporeSomaliaSouth AfricaSouth AmericaSouth Central AsiaSouth Eastern AsiaSouthern EuropeSpainSri LankaSt. Vincent and the GrenadinesSudanSwedenSwitzerlandSyriaTaiwanThailandTrinidad and TobagoTurkeyUgandaUkraineUruguayUzbekistanVenezuelaVietnamWest IndiesWestern AfricaWestern AsiaWestern EuropeYemenZaireZimbabweAzores
Choctaw
Race
Ancestry
AfghanAfricanAlaska NativeAlaskan AthabascanAlbanianAleutAlsatianAmericanApacheArabArapahoArgentineanArmenianAssyrian/Chaldean/SyriacAustralianAustrianBahamianBangladeshiBarbadianBasqueBelgianBelizeanBermudanBhutaneseBlackfeetBolivianBrazilianBritishBritish West IndianBulgarianBurmeseCajunCambodianCanadianCape VerdeanCarpatho RusynCelticCentral AmericanCentral American IndianCherokeeCheyenneChickasawChileanChineseChippewaChoctawColombianColvilleComancheCosta RicanCreeCreekCroatianCrowCubanCypriotCzechCzechoslovakianDanishDelawareDominicanDutchDutch West IndianEastern EuropeanEcuadorianEgyptianEnglishEstonianEthiopianEuropeanFijianFilipinoFinnishFrenchFrench American IndianFrench CanadianGermanGerman RussianGhanaianGreekGuamanian/ChamorroGuatemalanGuyaneseHaitianHmongHonduranHopiHoumaHungarianIcelanderIndian (Asian)IndonesianInupiatIranianIraqiIrishIroquoisIsraeliItalianJamaicanJapaneseJordanianKenyanKiowaKoreanLaotianLatvianLebaneseLiberianLithuanianLumbeeLuxembourgerMacedonianMalaysianMalteseMenomineeMexicanMexican American IndianMongolianMoroccanNative HawaiianNavajoNepaleseNew ZealanderNicaraguanNigerianNorthern EuropeanNorwegianOkinawanOsageOttawaPaiutePakistaniPalestinianPanamanianParaguayanPennsylvania GermanPeruvianPimaPolishPortuguesePotawatomiPuebloPuerto RicanPuget Sound SalishRomanianRussianSalvadoranSamoanScandinavianScotch-IrishScottishSeminoleSenegaleseSerbianShoshoneSierra LeoneanSiouxSlavicSlovakSloveneSomaliSouth AfricanSouth AmericanSouth American IndianSoviet UnionSpaniardSpanishSpanish AmericanSpanish American IndianSri LankanSubsaharan AfricanSudaneseSwedishSwissSyrianTaiwaneseThaiTlingit-HaidaTohono O'OdhamTonganTrinidadian and TobagonianTsimshianTurkishU.S. Virgin IslanderUgandanUkrainianUruguayanUteVenezuelanVietnameseWelshWest IndianYakamaYaquiYugoslavianYumanYup'ikZimbabwean
Immigration
NonimmigrantsImmigrantsAfghanistanAfricaAlbaniaArgentinaArmeniaAsiaAustraliaAustriaBahamasBangladeshBarbadosBelarusBelgiumBelizeBoliviaBosnia and HerzegovinaBrazilBulgariaBurma/MyanmarCabo VerdeCambodiaCameroonCanadaCaribbeanCentral AmericaChileChinaColombiaCongoCosta RicaCroatiaCubaCzechoslovakiaDenmarkDominicaDominican RepublicEastern AfricaEastern AsiaEastern EuropeEcuadorEgyptEl SalvadorEnglandEritreaEthiopiaEuropeFijiFranceGermanyGhanaGreeceGrenadaGuatemalaGuyanaHaitiHondurasHong KongHungaryIndiaIndonesiaIranIraqIrelandIsraelItalyJamaicaJapanJordanKazakhstanKenyaKoreaKuwaitLaosLatin AmericaLatviaLebanonLiberiaLithuaniaMalaysiaMexicoMicronesiaMiddle AfricaMoldovaMoroccoNepalNetherlandsNicaraguaNigeriaNorth AmericaNorth MacedoniaNorthern AfricaNorthern EuropeNorwayOceaniaPakistanPanamaPeruPhilippinesPolandPortugalRomaniaRussiaSaudi ArabiaScotlandSenegalSerbiaSierra LeoneSingaporeSomaliaSouth AfricaSouth AmericaSouth Central AsiaSouth Eastern AsiaSouthern EuropeSpainSri LankaSt. Vincent and the GrenadinesSudanSwedenSwitzerlandSyriaTaiwanThailandTrinidad and TobagoTurkeyUgandaUkraineUruguayUzbekistanVenezuelaVietnamWest IndiesWestern AfricaWestern AsiaWestern EuropeYemenZaireZimbabweAzores
Child Poverty Among Boys Under 16
Income
Poverty
Unemployment
Labor Participation
Family Structure
Vehicle Availability
Education Level
Disability

Child Poverty Among Boys Under 16 Comparison

Marshallese

Choctaw

Tragic
Tragic
18.4%
CHILD POVERTY AMONG BOYS UNDER 16
1.3/ 100
METRIC RATING
232nd/ 347
METRIC RANK
21.3%
CHILD POVERTY AMONG BOYS UNDER 16
0.0/ 100
METRIC RATING
307th/ 347
METRIC RANK

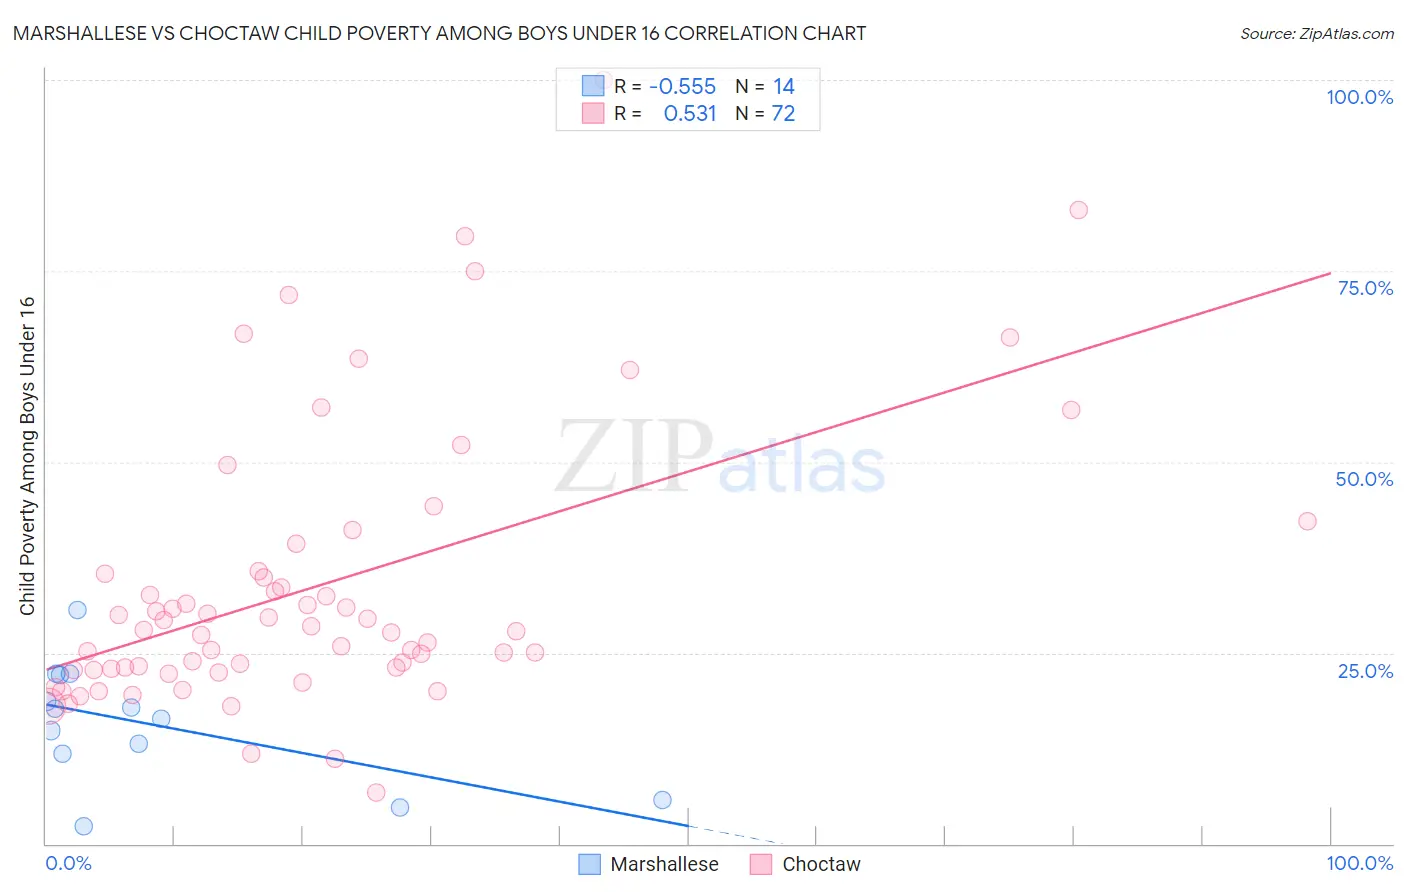
Marshallese vs Choctaw Child Poverty Among Boys Under 16 Correlation Chart

The statistical analysis conducted on geographies consisting of 14,730,412 people shows a substantial negative correlation between the proportion of Marshallese and poverty level among boys under the age of 16 in the United States with a correlation coefficient (R) of -0.555 and weighted average of 18.4%. Similarly, the statistical analysis conducted on geographies consisting of 267,402,535 people shows a substantial positive correlation between the proportion of Choctaw and poverty level among boys under the age of 16 in the United States with a correlation coefficient (R) of 0.531 and weighted average of 21.3%, a difference of 15.9%.
Marshallese vs Choctaw Child Poverty Among Boys Under 16

Child Poverty Among Boys Under 16 Correlation Summary

MeasurementMarshalleseChoctaw
Minimum2.3%6.7%
Maximum30.6%100.0%
Range28.3%93.3%
Mean15.7%33.8%
Median17.1%27.9%
Interquartile 25% (IQ1)11.8%22.9%
Interquartile 75% (IQ3)22.2%35.5%
Interquartile Range (IQR)10.3%12.6%
Standard Deviation (Sample)7.8%18.4%
Standard Deviation (Population)7.5%18.2%

Similar Demographics by Child Poverty Among Boys Under 16

Demographics Similar to Marshallese by Child Poverty Among Boys Under 16

In terms of child poverty among boys under 16, the demographic groups most similar to Marshallese are Immigrants from Nigeria (18.4%, a difference of 0.19%), Nicaraguan (18.4%, a difference of 0.20%), Nigerian (18.5%, a difference of 0.44%), Immigrants from Micronesia (18.3%, a difference of 0.73%), and Fijian (18.3%, a difference of 0.73%).
DemographicsRating | RankChild Poverty Among Boys Under 16
Inupiat
2.7
/100
|
#225
Tragic
18.1%
Immigrants | Africa
2.6
/100
|
#226
Tragic
18.1%
Bermudans
2.5
/100
|
#227
Tragic
18.1%
Immigrants | Nonimmigrants
2.2
/100
|
#228
Tragic
18.2%
Immigrants | Micronesia
1.8
/100
|
#229
Tragic
18.3%
Fijians
1.8
/100
|
#230
Tragic
18.3%
Nicaraguans
1.4
/100
|
#231
Tragic
18.4%
Marshallese
1.3
/100
|
#232
Tragic
18.4%
Immigrants | Nigeria
1.2
/100
|
#233
Tragic
18.4%
Nigerians
1.1
/100
|
#234
Tragic
18.5%
Americans
0.9
/100
|
#235
Tragic
18.6%
Sudanese
0.9
/100
|
#236
Tragic
18.6%
Immigrants | Eritrea
0.8
/100
|
#237
Tragic
18.6%
Immigrants | Laos
0.8
/100
|
#238
Tragic
18.7%
Cape Verdeans
0.7
/100
|
#239
Tragic
18.7%

Demographics Similar to Choctaw by Child Poverty Among Boys Under 16

In terms of child poverty among boys under 16, the demographic groups most similar to Choctaw are Immigrants from Grenada (21.3%, a difference of 0.090%), Kiowa (21.3%, a difference of 0.10%), Immigrants from Central America (21.3%, a difference of 0.27%), Immigrants from Haiti (21.3%, a difference of 0.33%), and Immigrants from Mexico (21.5%, a difference of 0.71%).
DemographicsRating | RankChild Poverty Among Boys Under 16
Haitians
0.0
/100
|
#300
Tragic
21.0%
Guatemalans
0.0
/100
|
#301
Tragic
21.1%
Somalis
0.0
/100
|
#302
Tragic
21.1%
Immigrants | Haiti
0.0
/100
|
#303
Tragic
21.3%
Immigrants | Central America
0.0
/100
|
#304
Tragic
21.3%
Kiowa
0.0
/100
|
#305
Tragic
21.3%
Immigrants | Grenada
0.0
/100
|
#306
Tragic
21.3%
Choctaw
0.0
/100
|
#307
Tragic
21.3%
Immigrants | Mexico
0.0
/100
|
#308
Tragic
21.5%
Seminole
0.0
/100
|
#309
Tragic
21.5%
Creek
0.0
/100
|
#310
Tragic
21.5%
Bahamians
0.0
/100
|
#311
Tragic
21.6%
Immigrants | Guatemala
0.0
/100
|
#312
Tragic
21.6%
British West Indians
0.0
/100
|
#313
Tragic
21.6%
Ute
0.0
/100
|
#314
Tragic
21.6%