Marshallese vs Chickasaw Single Father Poverty

COMPARE

Marshallese
Race
Ancestry
AfghanAfricanAlaska NativeAlaskan AthabascanAlbanianAleutAlsatianAmericanApacheArabArapahoArgentineanArmenianAssyrian/Chaldean/SyriacAustralianAustrianBahamianBangladeshiBarbadianBasqueBelgianBelizeanBermudanBhutaneseBlackfeetBolivianBrazilianBritishBritish West IndianBulgarianBurmeseCajunCambodianCanadianCape VerdeanCarpatho RusynCelticCentral AmericanCentral American IndianCherokeeCheyenneChileanChineseChippewaChoctawColombianColvilleComancheCosta RicanCreeCreekCroatianCrowCubanCypriotCzechCzechoslovakianDanishDelawareDominicanDutchDutch West IndianEastern EuropeanEcuadorianEgyptianEnglishEstonianEthiopianEuropeanFijianFilipinoFinnishFrenchFrench American IndianFrench CanadianGermanGerman RussianGhanaianGreekGuamanian/ChamorroGuatemalanGuyaneseHaitianHmongHonduranHopiHoumaHungarianIcelanderIndian (Asian)IndonesianInupiatIranianIraqiIrishIroquoisIsraeliItalianJamaicanJapaneseJordanianKenyanKiowaKoreanLaotianLatvianLebaneseLiberianLithuanianLumbeeLuxembourgerMacedonianMalaysianMalteseMarshalleseMenomineeMexicanMexican American IndianMongolianMoroccanNative HawaiianNavajoNepaleseNew ZealanderNicaraguanNigerianNorthern EuropeanNorwegianOkinawanOsageOttawaPaiutePakistaniPalestinianPanamanianParaguayanPennsylvania GermanPeruvianPimaPolishPortuguesePotawatomiPuebloPuerto RicanPuget Sound SalishRomanianRussianSalvadoranSamoanScandinavianScotch-IrishScottishSeminoleSenegaleseSerbianShoshoneSierra LeoneanSiouxSlavicSlovakSloveneSomaliSouth AfricanSouth AmericanSouth American IndianSoviet UnionSpaniardSpanishSpanish AmericanSpanish American IndianSri LankanSubsaharan AfricanSudaneseSwedishSwissSyrianTaiwaneseThaiTlingit-HaidaTohono O'OdhamTonganTrinidadian and TobagonianTsimshianTurkishU.S. Virgin IslanderUgandanUkrainianUruguayanUteVenezuelanVietnameseWelshWest IndianYakamaYaquiYugoslavianYumanYup'ikZimbabwean
Immigration
NonimmigrantsImmigrantsAfghanistanAfricaAlbaniaArgentinaArmeniaAsiaAustraliaAustriaBahamasBangladeshBarbadosBelarusBelgiumBelizeBoliviaBosnia and HerzegovinaBrazilBulgariaBurma/MyanmarCabo VerdeCambodiaCameroonCanadaCaribbeanCentral AmericaChileChinaColombiaCongoCosta RicaCroatiaCubaCzechoslovakiaDenmarkDominicaDominican RepublicEastern AfricaEastern AsiaEastern EuropeEcuadorEgyptEl SalvadorEnglandEritreaEthiopiaEuropeFijiFranceGermanyGhanaGreeceGrenadaGuatemalaGuyanaHaitiHondurasHong KongHungaryIndiaIndonesiaIranIraqIrelandIsraelItalyJamaicaJapanJordanKazakhstanKenyaKoreaKuwaitLaosLatin AmericaLatviaLebanonLiberiaLithuaniaMalaysiaMexicoMicronesiaMiddle AfricaMoldovaMoroccoNepalNetherlandsNicaraguaNigeriaNorth AmericaNorth MacedoniaNorthern AfricaNorthern EuropeNorwayOceaniaPakistanPanamaPeruPhilippinesPolandPortugalRomaniaRussiaSaudi ArabiaScotlandSenegalSerbiaSierra LeoneSingaporeSomaliaSouth AfricaSouth AmericaSouth Central AsiaSouth Eastern AsiaSouthern EuropeSpainSri LankaSt. Vincent and the GrenadinesSudanSwedenSwitzerlandSyriaTaiwanThailandTrinidad and TobagoTurkeyUgandaUkraineUruguayUzbekistanVenezuelaVietnamWest IndiesWestern AfricaWestern AsiaWestern EuropeYemenZaireZimbabweAzores
Chickasaw
Race
Ancestry
AfghanAfricanAlaska NativeAlaskan AthabascanAlbanianAleutAlsatianAmericanApacheArabArapahoArgentineanArmenianAssyrian/Chaldean/SyriacAustralianAustrianBahamianBangladeshiBarbadianBasqueBelgianBelizeanBermudanBhutaneseBlackfeetBolivianBrazilianBritishBritish West IndianBulgarianBurmeseCajunCambodianCanadianCape VerdeanCarpatho RusynCelticCentral AmericanCentral American IndianCherokeeCheyenneChickasawChileanChineseChippewaChoctawColombianColvilleComancheCosta RicanCreeCreekCroatianCrowCubanCypriotCzechCzechoslovakianDanishDelawareDominicanDutchDutch West IndianEastern EuropeanEcuadorianEgyptianEnglishEstonianEthiopianEuropeanFijianFilipinoFinnishFrenchFrench American IndianFrench CanadianGermanGerman RussianGhanaianGreekGuamanian/ChamorroGuatemalanGuyaneseHaitianHmongHonduranHopiHoumaHungarianIcelanderIndian (Asian)IndonesianInupiatIranianIraqiIrishIroquoisIsraeliItalianJamaicanJapaneseJordanianKenyanKiowaKoreanLaotianLatvianLebaneseLiberianLithuanianLumbeeLuxembourgerMacedonianMalaysianMalteseMenomineeMexicanMexican American IndianMongolianMoroccanNative HawaiianNavajoNepaleseNew ZealanderNicaraguanNigerianNorthern EuropeanNorwegianOkinawanOsageOttawaPaiutePakistaniPalestinianPanamanianParaguayanPennsylvania GermanPeruvianPimaPolishPortuguesePotawatomiPuebloPuerto RicanPuget Sound SalishRomanianRussianSalvadoranSamoanScandinavianScotch-IrishScottishSeminoleSenegaleseSerbianShoshoneSierra LeoneanSiouxSlavicSlovakSloveneSomaliSouth AfricanSouth AmericanSouth American IndianSoviet UnionSpaniardSpanishSpanish AmericanSpanish American IndianSri LankanSubsaharan AfricanSudaneseSwedishSwissSyrianTaiwaneseThaiTlingit-HaidaTohono O'OdhamTonganTrinidadian and TobagonianTsimshianTurkishU.S. Virgin IslanderUgandanUkrainianUruguayanUteVenezuelanVietnameseWelshWest IndianYakamaYaquiYugoslavianYumanYup'ikZimbabwean
Immigration
NonimmigrantsImmigrantsAfghanistanAfricaAlbaniaArgentinaArmeniaAsiaAustraliaAustriaBahamasBangladeshBarbadosBelarusBelgiumBelizeBoliviaBosnia and HerzegovinaBrazilBulgariaBurma/MyanmarCabo VerdeCambodiaCameroonCanadaCaribbeanCentral AmericaChileChinaColombiaCongoCosta RicaCroatiaCubaCzechoslovakiaDenmarkDominicaDominican RepublicEastern AfricaEastern AsiaEastern EuropeEcuadorEgyptEl SalvadorEnglandEritreaEthiopiaEuropeFijiFranceGermanyGhanaGreeceGrenadaGuatemalaGuyanaHaitiHondurasHong KongHungaryIndiaIndonesiaIranIraqIrelandIsraelItalyJamaicaJapanJordanKazakhstanKenyaKoreaKuwaitLaosLatin AmericaLatviaLebanonLiberiaLithuaniaMalaysiaMexicoMicronesiaMiddle AfricaMoldovaMoroccoNepalNetherlandsNicaraguaNigeriaNorth AmericaNorth MacedoniaNorthern AfricaNorthern EuropeNorwayOceaniaPakistanPanamaPeruPhilippinesPolandPortugalRomaniaRussiaSaudi ArabiaScotlandSenegalSerbiaSierra LeoneSingaporeSomaliaSouth AfricaSouth AmericaSouth Central AsiaSouth Eastern AsiaSouthern EuropeSpainSri LankaSt. Vincent and the GrenadinesSudanSwedenSwitzerlandSyriaTaiwanThailandTrinidad and TobagoTurkeyUgandaUkraineUruguayUzbekistanVenezuelaVietnamWest IndiesWestern AfricaWestern AsiaWestern EuropeYemenZaireZimbabweAzores
Single Father Poverty
Income
Poverty
Unemployment
Labor Participation
Family Structure
Vehicle Availability
Education Level
Disability

Single Father Poverty Comparison

Marshallese

Chickasaw

Tragic
Tragic
16.9%
SINGLE FATHER POVERTY
3.1/ 100
METRIC RATING
234th/ 347
METRIC RANK
19.0%
SINGLE FATHER POVERTY
0.0/ 100
METRIC RATING
315th/ 347
METRIC RANK

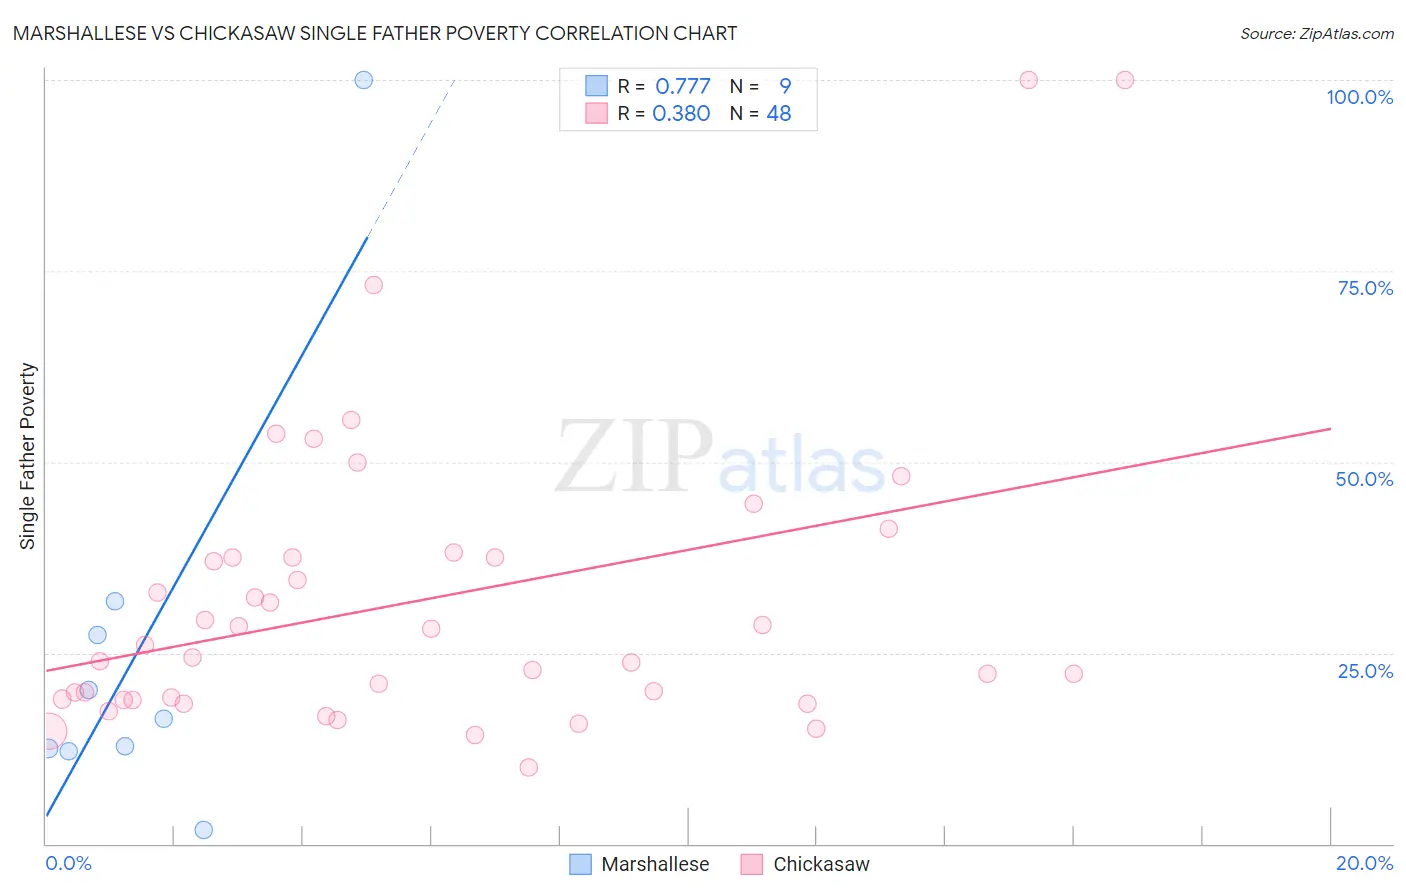
Marshallese vs Chickasaw Single Father Poverty Correlation Chart

The statistical analysis conducted on geographies consisting of 13,927,336 people shows a strong positive correlation between the proportion of Marshallese and poverty level among single fathers in the United States with a correlation coefficient (R) of 0.777 and weighted average of 16.9%. Similarly, the statistical analysis conducted on geographies consisting of 131,493,414 people shows a mild positive correlation between the proportion of Chickasaw and poverty level among single fathers in the United States with a correlation coefficient (R) of 0.380 and weighted average of 19.0%, a difference of 12.1%.
Marshallese vs Chickasaw Single Father Poverty

Single Father Poverty Correlation Summary

MeasurementMarshalleseChickasaw
Minimum1.9%10.0%
Maximum100.0%100.0%
Range98.1%90.0%
Mean26.1%31.9%
Median16.3%25.2%
Interquartile 25% (IQ1)12.3%18.9%
Interquartile 75% (IQ3)29.5%37.5%
Interquartile Range (IQR)17.2%18.6%
Standard Deviation (Sample)29.1%19.5%
Standard Deviation (Population)27.4%19.3%

Similar Demographics by Single Father Poverty

Demographics Similar to Marshallese by Single Father Poverty

In terms of single father poverty, the demographic groups most similar to Marshallese are Senegalese (16.9%, a difference of 0.030%), Immigrants from Western Europe (16.9%, a difference of 0.10%), Immigrants from Germany (16.9%, a difference of 0.10%), Subsaharan African (16.9%, a difference of 0.10%), and Immigrants from Grenada (16.9%, a difference of 0.17%).
DemographicsRating | RankSingle Father Poverty
British
5.6
/100
|
#227
Tragic
16.8%
Belgians
5.3
/100
|
#228
Tragic
16.8%
Israelis
4.6
/100
|
#229
Tragic
16.8%
Immigrants | Trinidad and Tobago
4.5
/100
|
#230
Tragic
16.8%
Spanish Americans
3.7
/100
|
#231
Tragic
16.9%
Immigrants | Grenada
3.7
/100
|
#232
Tragic
16.9%
Senegalese
3.2
/100
|
#233
Tragic
16.9%
Marshallese
3.1
/100
|
#234
Tragic
16.9%
Immigrants | Western Europe
2.9
/100
|
#235
Tragic
16.9%
Immigrants | Germany
2.9
/100
|
#236
Tragic
16.9%
Sub-Saharan Africans
2.9
/100
|
#237
Tragic
16.9%
Immigrants | Saudi Arabia
2.7
/100
|
#238
Tragic
16.9%
Bermudans
2.6
/100
|
#239
Tragic
16.9%
Finns
2.6
/100
|
#240
Tragic
16.9%
Czechs
2.3
/100
|
#241
Tragic
17.0%

Demographics Similar to Chickasaw by Single Father Poverty

In terms of single father poverty, the demographic groups most similar to Chickasaw are Delaware (18.9%, a difference of 0.16%), Potawatomi (18.9%, a difference of 0.32%), Osage (19.0%, a difference of 0.40%), Immigrants from Dominica (18.9%, a difference of 0.52%), and Nonimmigrants (18.8%, a difference of 0.57%).
DemographicsRating | RankSingle Father Poverty
Ottawa
0.0
/100
|
#308
Tragic
18.6%
Immigrants | Micronesia
0.0
/100
|
#309
Tragic
18.6%
Chippewa
0.0
/100
|
#310
Tragic
18.8%
Immigrants | Nonimmigrants
0.0
/100
|
#311
Tragic
18.8%
Immigrants | Dominica
0.0
/100
|
#312
Tragic
18.9%
Potawatomi
0.0
/100
|
#313
Tragic
18.9%
Delaware
0.0
/100
|
#314
Tragic
18.9%
Chickasaw
0.0
/100
|
#315
Tragic
19.0%
Osage
0.0
/100
|
#316
Tragic
19.0%
Dominicans
0.0
/100
|
#317
Tragic
19.1%
Dutch West Indians
0.0
/100
|
#318
Tragic
19.2%
Slovaks
0.0
/100
|
#319
Tragic
19.3%
Inupiat
0.0
/100
|
#320
Tragic
19.5%
Cherokee
0.0
/100
|
#321
Tragic
19.6%
Creek
0.0
/100
|
#322
Tragic
19.8%