Malaysian vs Vietnamese Family Poverty
COMPARE
Malaysian
Vietnamese
Family Poverty
Family Poverty Comparison
Malaysians
Vietnamese
9.6%
FAMILY POVERTY
10.6/ 100
METRIC RATING
211th/ 347
METRIC RANK
11.5%
FAMILY POVERTY
0.0/ 100
METRIC RATING
287th/ 347
METRIC RANK
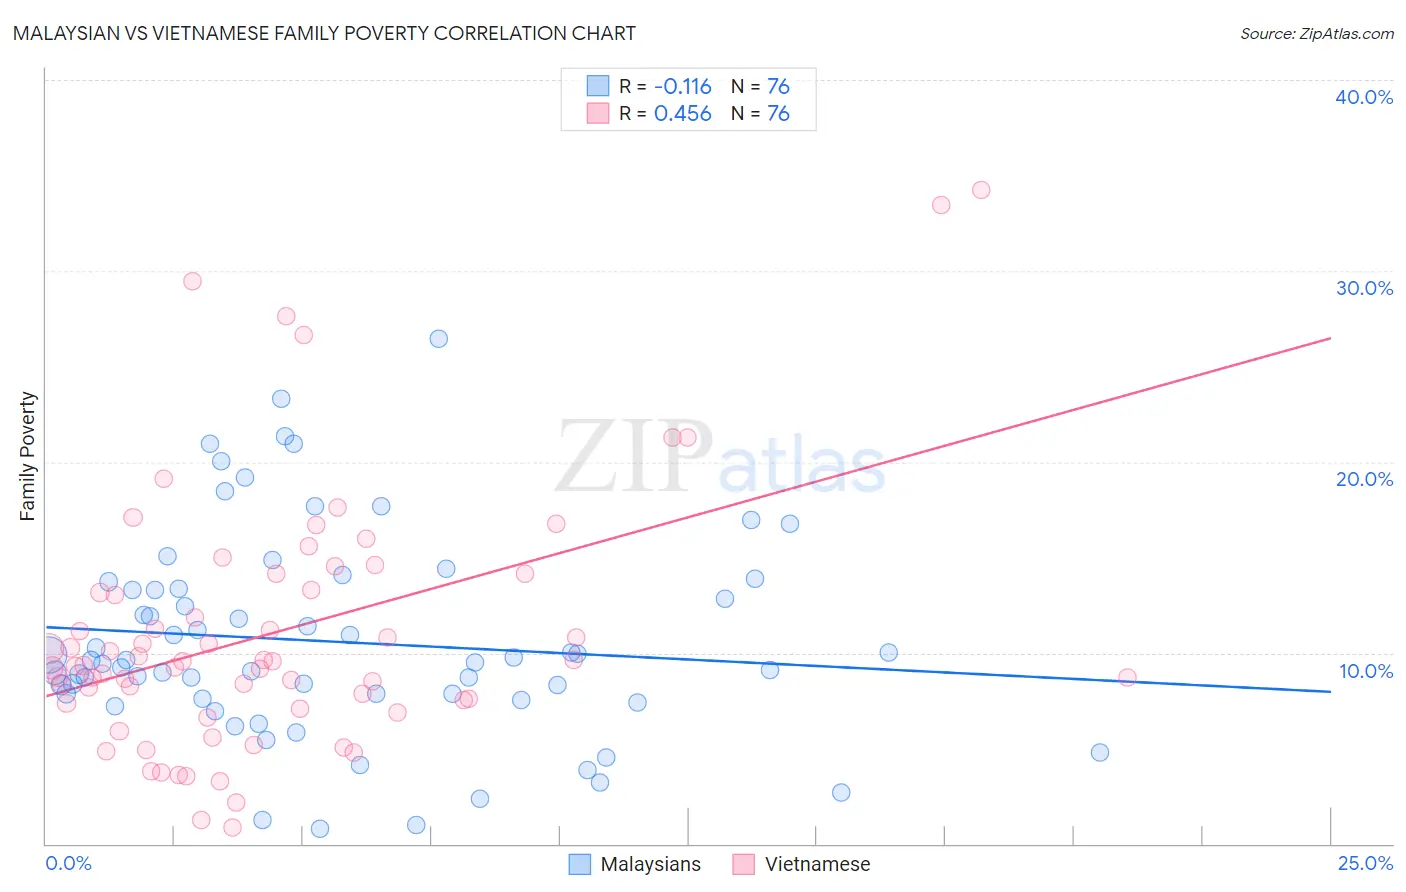
Malaysian vs Vietnamese Family Poverty Correlation Chart
The statistical analysis conducted on geographies consisting of 225,820,705 people shows a poor negative correlation between the proportion of Malaysians and poverty level among families in the United States with a correlation coefficient (R) of -0.116 and weighted average of 9.6%. Similarly, the statistical analysis conducted on geographies consisting of 170,550,296 people shows a moderate positive correlation between the proportion of Vietnamese and poverty level among families in the United States with a correlation coefficient (R) of 0.456 and weighted average of 11.5%, a difference of 19.3%.
Family Poverty Correlation Summary
| Measurement | Malaysian | Vietnamese |
| Minimum | 0.81% | 0.88% |
| Maximum | 26.5% | 34.2% |
| Range | 25.6% | 33.4% |
| Mean | 10.6% | 11.1% |
| Median | 9.6% | 9.4% |
| Interquartile 25% (IQ1) | 7.7% | 7.4% |
| Interquartile 75% (IQ3) | 13.3% | 13.7% |
| Interquartile Range (IQR) | 5.6% | 6.3% |
| Standard Deviation (Sample) | 5.3% | 6.8% |
| Standard Deviation (Population) | 5.3% | 6.7% |
Similar Demographics by Family Poverty
Demographics Similar to Malaysians by Family Poverty
In terms of family poverty, the demographic groups most similar to Malaysians are Alsatian (9.6%, a difference of 0.23%), Immigrants from Thailand (9.7%, a difference of 0.30%), Osage (9.7%, a difference of 0.94%), Immigrants from Uruguay (9.5%, a difference of 0.97%), and Immigrants from Eastern Africa (9.5%, a difference of 1.3%).
| Demographics | Rating | Rank | Family Poverty |
| Immigrants | Lebanon | 18.9 /100 | #204 | Poor 9.4% |
| Aleuts | 18.0 /100 | #205 | Poor 9.5% |
| Immigrants | South America | 18.0 /100 | #206 | Poor 9.5% |
| Sierra Leoneans | 15.6 /100 | #207 | Poor 9.5% |
| Immigrants | Eastern Africa | 15.1 /100 | #208 | Poor 9.5% |
| Immigrants | Uruguay | 14.0 /100 | #209 | Poor 9.5% |
| Alsatians | 11.3 /100 | #210 | Poor 9.6% |
| Malaysians | 10.6 /100 | #211 | Poor 9.6% |
| Immigrants | Thailand | 9.7 /100 | #212 | Tragic 9.7% |
| Osage | 8.0 /100 | #213 | Tragic 9.7% |
| Immigrants | Micronesia | 6.7 /100 | #214 | Tragic 9.8% |
| Immigrants | Nonimmigrants | 6.7 /100 | #215 | Tragic 9.8% |
| Moroccans | 6.5 /100 | #216 | Tragic 9.8% |
| Americans | 6.2 /100 | #217 | Tragic 9.8% |
| Panamanians | 5.6 /100 | #218 | Tragic 9.8% |
Demographics Similar to Vietnamese by Family Poverty
In terms of family poverty, the demographic groups most similar to Vietnamese are Immigrants from Belize (11.5%, a difference of 0.19%), Immigrants from Barbados (11.5%, a difference of 0.24%), West Indian (11.5%, a difference of 0.25%), Senegalese (11.5%, a difference of 0.27%), and Haitian (11.5%, a difference of 0.31%).
| Demographics | Rating | Rank | Family Poverty |
| Belizeans | 0.0 /100 | #280 | Tragic 11.3% |
| Immigrants | West Indies | 0.0 /100 | #281 | Tragic 11.3% |
| Immigrants | Cuba | 0.0 /100 | #282 | Tragic 11.3% |
| Indonesians | 0.0 /100 | #283 | Tragic 11.3% |
| Yaqui | 0.0 /100 | #284 | Tragic 11.3% |
| Barbadians | 0.0 /100 | #285 | Tragic 11.3% |
| Senegalese | 0.0 /100 | #286 | Tragic 11.5% |
| Vietnamese | 0.0 /100 | #287 | Tragic 11.5% |
| Immigrants | Belize | 0.0 /100 | #288 | Tragic 11.5% |
| Immigrants | Barbados | 0.0 /100 | #289 | Tragic 11.5% |
| West Indians | 0.0 /100 | #290 | Tragic 11.5% |
| Haitians | 0.0 /100 | #291 | Tragic 11.5% |
| Immigrants | Somalia | 0.0 /100 | #292 | Tragic 11.5% |
| Immigrants | Cabo Verde | 0.0 /100 | #293 | Tragic 11.6% |
| Immigrants | St. Vincent and the Grenadines | 0.0 /100 | #294 | Tragic 11.6% |