Malaysian vs Vietnamese Family Households
COMPARE
Malaysian
Vietnamese
Family Households
Family Households Comparison
Malaysians
Vietnamese
65.9%
FAMILY HOUSEHOLDS
99.9/ 100
METRIC RATING
69th/ 347
METRIC RANK
64.2%
FAMILY HOUSEHOLDS
43.6/ 100
METRIC RATING
176th/ 347
METRIC RANK
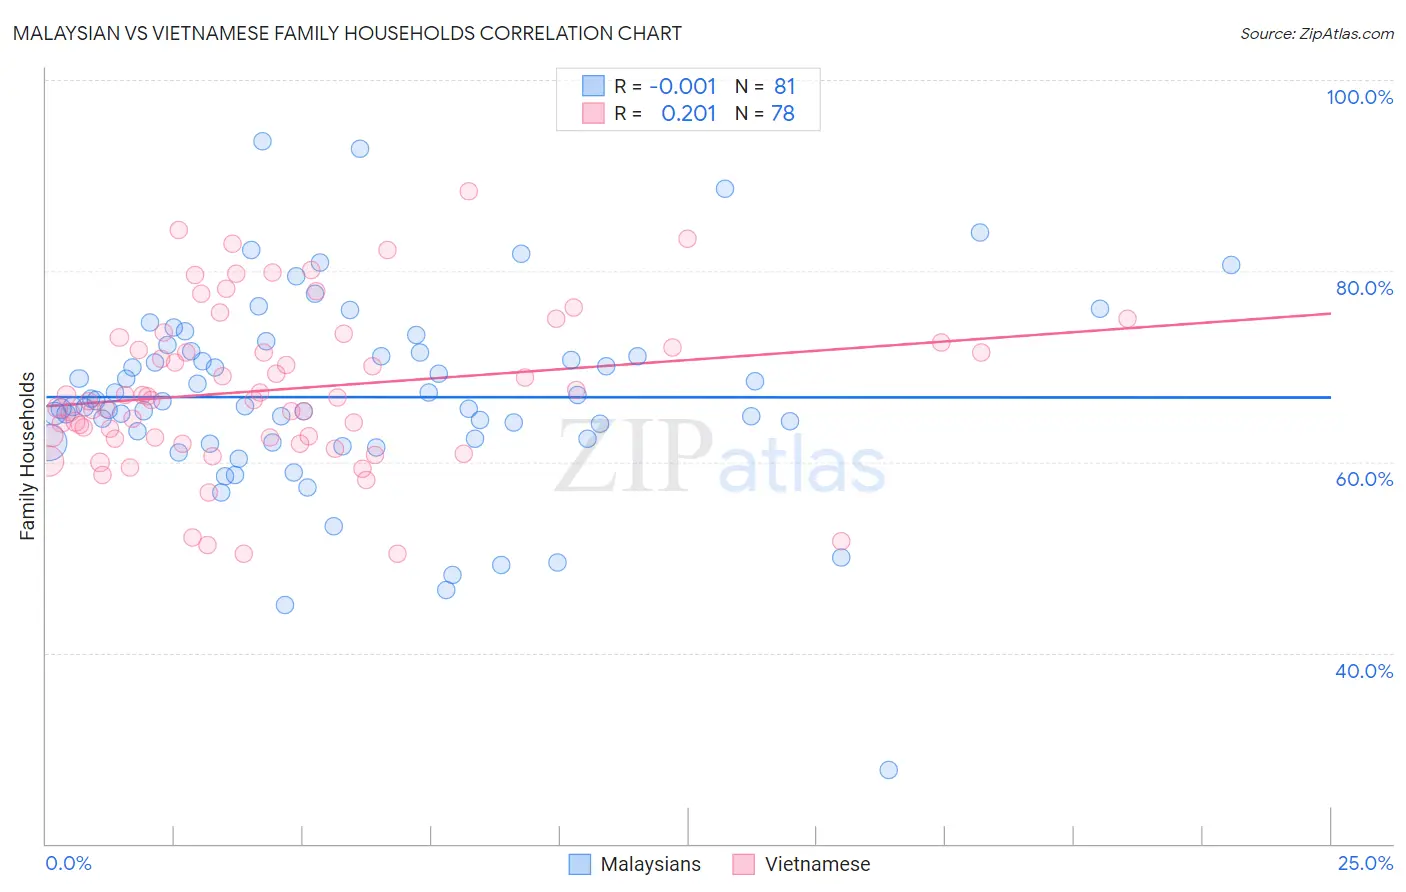
Malaysian vs Vietnamese Family Households Correlation Chart
The statistical analysis conducted on geographies consisting of 226,012,303 people shows no correlation between the proportion of Malaysians and percentage of family households in the United States with a correlation coefficient (R) of -0.001 and weighted average of 65.9%. Similarly, the statistical analysis conducted on geographies consisting of 170,660,607 people shows a weak positive correlation between the proportion of Vietnamese and percentage of family households in the United States with a correlation coefficient (R) of 0.201 and weighted average of 64.2%, a difference of 2.5%.
Family Households Correlation Summary
| Measurement | Malaysian | Vietnamese |
| Minimum | 27.8% | 50.4% |
| Maximum | 93.6% | 88.4% |
| Range | 65.8% | 38.0% |
| Mean | 66.8% | 67.6% |
| Median | 65.9% | 66.7% |
| Interquartile 25% (IQ1) | 62.2% | 62.6% |
| Interquartile 75% (IQ3) | 71.5% | 72.5% |
| Interquartile Range (IQR) | 9.3% | 9.9% |
| Standard Deviation (Sample) | 10.3% | 8.2% |
| Standard Deviation (Population) | 10.3% | 8.2% |
Similar Demographics by Family Households
Demographics Similar to Malaysians by Family Households
In terms of family households, the demographic groups most similar to Malaysians are Immigrants from Afghanistan (65.9%, a difference of 0.010%), Bhutanese (65.9%, a difference of 0.020%), Japanese (65.9%, a difference of 0.030%), Fijian (65.9%, a difference of 0.050%), and Filipino (65.9%, a difference of 0.050%).
| Demographics | Rating | Rank | Family Households |
| Central Americans | 100.0 /100 | #62 | Exceptional 66.0% |
| Immigrants | Indonesia | 100.0 /100 | #63 | Exceptional 66.0% |
| Pima | 99.9 /100 | #64 | Exceptional 65.9% |
| Costa Ricans | 99.9 /100 | #65 | Exceptional 65.9% |
| Fijians | 99.9 /100 | #66 | Exceptional 65.9% |
| Filipinos | 99.9 /100 | #67 | Exceptional 65.9% |
| Japanese | 99.9 /100 | #68 | Exceptional 65.9% |
| Malaysians | 99.9 /100 | #69 | Exceptional 65.9% |
| Immigrants | Afghanistan | 99.9 /100 | #70 | Exceptional 65.9% |
| Bhutanese | 99.9 /100 | #71 | Exceptional 65.9% |
| Portuguese | 99.9 /100 | #72 | Exceptional 65.8% |
| Laotians | 99.9 /100 | #73 | Exceptional 65.8% |
| Burmese | 99.9 /100 | #74 | Exceptional 65.7% |
| Houma | 99.9 /100 | #75 | Exceptional 65.7% |
| Immigrants | Azores | 99.8 /100 | #76 | Exceptional 65.6% |
Demographics Similar to Vietnamese by Family Households
In terms of family households, the demographic groups most similar to Vietnamese are Bangladeshi (64.3%, a difference of 0.010%), Immigrants from Micronesia (64.2%, a difference of 0.020%), Jamaican (64.2%, a difference of 0.040%), Immigrants from Ukraine (64.2%, a difference of 0.080%), and Immigrants from Germany (64.3%, a difference of 0.090%).
| Demographics | Rating | Rank | Family Households |
| Iraqis | 56.0 /100 | #169 | Average 64.4% |
| Armenians | 55.9 /100 | #170 | Average 64.4% |
| Ute | 54.6 /100 | #171 | Average 64.3% |
| Dutch West Indians | 53.9 /100 | #172 | Average 64.3% |
| Immigrants | Sierra Leone | 52.5 /100 | #173 | Average 64.3% |
| Immigrants | Germany | 50.0 /100 | #174 | Average 64.3% |
| Bangladeshis | 44.3 /100 | #175 | Average 64.3% |
| Vietnamese | 43.6 /100 | #176 | Average 64.2% |
| Immigrants | Micronesia | 42.3 /100 | #177 | Average 64.2% |
| Jamaicans | 40.6 /100 | #178 | Average 64.2% |
| Immigrants | Ukraine | 38.2 /100 | #179 | Fair 64.2% |
| Immigrants | Honduras | 35.0 /100 | #180 | Fair 64.2% |
| Immigrants | Trinidad and Tobago | 34.9 /100 | #181 | Fair 64.2% |
| Ukrainians | 34.6 /100 | #182 | Fair 64.2% |
| Creek | 34.1 /100 | #183 | Fair 64.2% |