Malaysian vs Sudanese Male Poverty
COMPARE
Malaysian
Sudanese
Male Poverty
Male Poverty Comparison
Malaysians
Sudanese
12.0%
MALE POVERTY
5.2/ 100
METRIC RATING
207th/ 347
METRIC RANK
12.8%
MALE POVERTY
0.3/ 100
METRIC RATING
241st/ 347
METRIC RANK
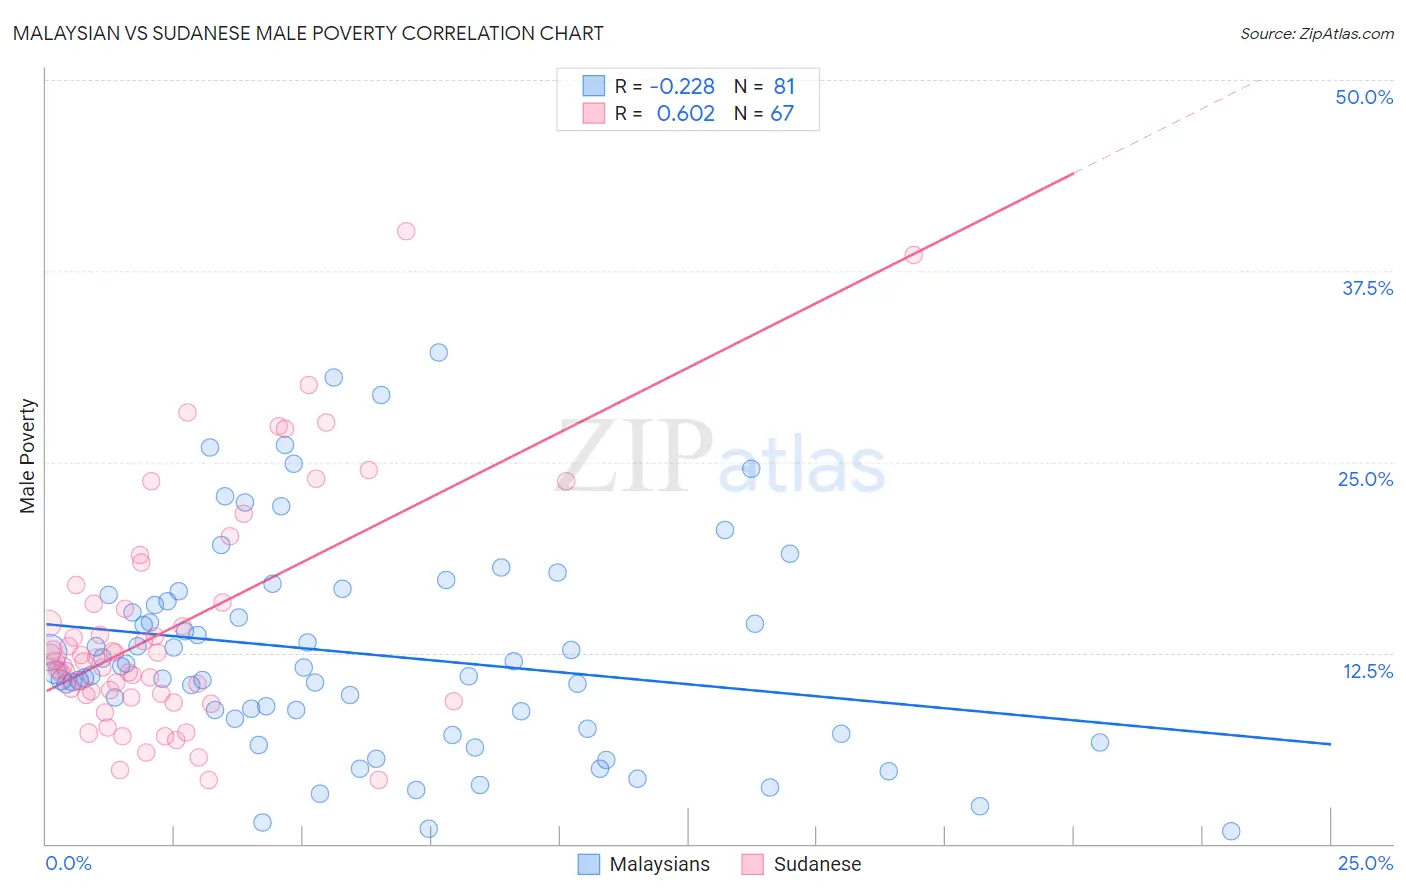
Malaysian vs Sudanese Male Poverty Correlation Chart
The statistical analysis conducted on geographies consisting of 225,986,127 people shows a weak negative correlation between the proportion of Malaysians and poverty level among males in the United States with a correlation coefficient (R) of -0.228 and weighted average of 12.0%. Similarly, the statistical analysis conducted on geographies consisting of 110,106,340 people shows a significant positive correlation between the proportion of Sudanese and poverty level among males in the United States with a correlation coefficient (R) of 0.602 and weighted average of 12.8%, a difference of 6.5%.
Male Poverty Correlation Summary
| Measurement | Malaysian | Sudanese |
| Minimum | 0.78% | 4.2% |
| Maximum | 32.2% | 40.1% |
| Range | 31.4% | 35.9% |
| Mean | 12.5% | 14.2% |
| Median | 11.2% | 12.0% |
| Interquartile 25% (IQ1) | 7.9% | 9.8% |
| Interquartile 75% (IQ3) | 16.1% | 15.8% |
| Interquartile Range (IQR) | 8.2% | 6.1% |
| Standard Deviation (Sample) | 6.9% | 7.6% |
| Standard Deviation (Population) | 6.9% | 7.6% |
Similar Demographics by Male Poverty
Demographics Similar to Malaysians by Male Poverty
In terms of male poverty, the demographic groups most similar to Malaysians are Immigrants from Eastern Africa (12.0%, a difference of 0.10%), Immigrants (12.0%, a difference of 0.33%), Immigrants from the Azores (12.0%, a difference of 0.44%), Panamanian (11.9%, a difference of 0.45%), and Moroccan (12.0%, a difference of 0.50%).
| Demographics | Rating | Rank | Male Poverty |
| Immigrants | Lebanon | 13.6 /100 | #200 | Poor 11.7% |
| Spaniards | 13.5 /100 | #201 | Poor 11.7% |
| Aleuts | 10.4 /100 | #202 | Poor 11.8% |
| Immigrants | Western Asia | 9.8 /100 | #203 | Tragic 11.8% |
| Immigrants | Uganda | 8.5 /100 | #204 | Tragic 11.8% |
| Panamanians | 6.2 /100 | #205 | Tragic 11.9% |
| Immigrants | Eastern Africa | 5.4 /100 | #206 | Tragic 12.0% |
| Malaysians | 5.2 /100 | #207 | Tragic 12.0% |
| Immigrants | Immigrants | 4.5 /100 | #208 | Tragic 12.0% |
| Immigrants | Azores | 4.3 /100 | #209 | Tragic 12.0% |
| Moroccans | 4.2 /100 | #210 | Tragic 12.0% |
| Immigrants | Panama | 4.0 /100 | #211 | Tragic 12.1% |
| Americans | 3.2 /100 | #212 | Tragic 12.1% |
| Immigrants | Nonimmigrants | 3.1 /100 | #213 | Tragic 12.1% |
| Japanese | 2.7 /100 | #214 | Tragic 12.2% |
Demographics Similar to Sudanese by Male Poverty
In terms of male poverty, the demographic groups most similar to Sudanese are Nepalese (12.8%, a difference of 0.17%), Alaskan Athabascan (12.8%, a difference of 0.20%), Tsimshian (12.8%, a difference of 0.31%), Liberian (12.8%, a difference of 0.32%), and Immigrants from Middle Africa (12.7%, a difference of 0.36%).
| Demographics | Rating | Rank | Male Poverty |
| Immigrants | Armenia | 0.6 /100 | #234 | Tragic 12.6% |
| Immigrants | Laos | 0.5 /100 | #235 | Tragic 12.6% |
| Immigrants | Saudi Arabia | 0.4 /100 | #236 | Tragic 12.7% |
| French American Indians | 0.4 /100 | #237 | Tragic 12.7% |
| Ecuadorians | 0.4 /100 | #238 | Tragic 12.7% |
| Ghanaians | 0.4 /100 | #239 | Tragic 12.7% |
| Immigrants | Middle Africa | 0.4 /100 | #240 | Tragic 12.7% |
| Sudanese | 0.3 /100 | #241 | Tragic 12.8% |
| Nepalese | 0.3 /100 | #242 | Tragic 12.8% |
| Alaskan Athabascans | 0.3 /100 | #243 | Tragic 12.8% |
| Tsimshian | 0.3 /100 | #244 | Tragic 12.8% |
| Liberians | 0.3 /100 | #245 | Tragic 12.8% |
| Immigrants | El Salvador | 0.2 /100 | #246 | Tragic 12.8% |
| Immigrants | Western Africa | 0.2 /100 | #247 | Tragic 12.9% |
| Immigrants | Sudan | 0.2 /100 | #248 | Tragic 12.9% |