Malaysian vs Maltese Male Poverty

COMPARE

Malaysian
Race
Ancestry
AfghanAfricanAlaska NativeAlaskan AthabascanAlbanianAleutAlsatianAmericanApacheArabArapahoArgentineanArmenianAssyrian/Chaldean/SyriacAustralianAustrianBahamianBangladeshiBarbadianBasqueBelgianBelizeanBermudanBhutaneseBlackfeetBolivianBrazilianBritishBritish West IndianBulgarianBurmeseCajunCambodianCanadianCape VerdeanCarpatho RusynCelticCentral AmericanCentral American IndianCherokeeCheyenneChickasawChileanChineseChippewaChoctawColombianColvilleComancheCosta RicanCreeCreekCroatianCrowCubanCypriotCzechCzechoslovakianDanishDelawareDominicanDutchDutch West IndianEastern EuropeanEcuadorianEgyptianEnglishEstonianEthiopianEuropeanFijianFilipinoFinnishFrenchFrench American IndianFrench CanadianGermanGerman RussianGhanaianGreekGuamanian/ChamorroGuatemalanGuyaneseHaitianHmongHonduranHopiHoumaHungarianIcelanderIndian (Asian)IndonesianInupiatIranianIraqiIrishIroquoisIsraeliItalianJamaicanJapaneseJordanianKenyanKiowaKoreanLaotianLatvianLebaneseLiberianLithuanianLumbeeLuxembourgerMacedonianMalaysianMarshalleseMenomineeMexicanMexican American IndianMongolianMoroccanNative HawaiianNavajoNepaleseNew ZealanderNicaraguanNigerianNorthern EuropeanNorwegianOkinawanOsageOttawaPaiutePakistaniPalestinianPanamanianParaguayanPennsylvania GermanPeruvianPimaPolishPortuguesePotawatomiPuebloPuerto RicanPuget Sound SalishRomanianRussianSalvadoranSamoanScandinavianScotch-IrishScottishSeminoleSenegaleseSerbianShoshoneSierra LeoneanSiouxSlavicSlovakSloveneSomaliSouth AfricanSouth AmericanSouth American IndianSoviet UnionSpaniardSpanishSpanish AmericanSpanish American IndianSri LankanSubsaharan AfricanSudaneseSwedishSwissSyrianTaiwaneseThaiTlingit-HaidaTohono O'OdhamTonganTrinidadian and TobagonianTsimshianTurkishU.S. Virgin IslanderUgandanUkrainianUruguayanUteVenezuelanVietnameseWelshWest IndianYakamaYaquiYugoslavianYumanYup'ikZimbabwean
Immigration
NonimmigrantsImmigrantsAfghanistanAfricaAlbaniaArgentinaArmeniaAsiaAustraliaAustriaBahamasBangladeshBarbadosBelarusBelgiumBelizeBoliviaBosnia and HerzegovinaBrazilBulgariaBurma/MyanmarCabo VerdeCambodiaCameroonCanadaCaribbeanCentral AmericaChileChinaColombiaCongoCosta RicaCroatiaCubaCzechoslovakiaDenmarkDominicaDominican RepublicEastern AfricaEastern AsiaEastern EuropeEcuadorEgyptEl SalvadorEnglandEritreaEthiopiaEuropeFijiFranceGermanyGhanaGreeceGrenadaGuatemalaGuyanaHaitiHondurasHong KongHungaryIndiaIndonesiaIranIraqIrelandIsraelItalyJamaicaJapanJordanKazakhstanKenyaKoreaKuwaitLaosLatin AmericaLatviaLebanonLiberiaLithuaniaMalaysiaMexicoMicronesiaMiddle AfricaMoldovaMoroccoNepalNetherlandsNicaraguaNigeriaNorth AmericaNorth MacedoniaNorthern AfricaNorthern EuropeNorwayOceaniaPakistanPanamaPeruPhilippinesPolandPortugalRomaniaRussiaSaudi ArabiaScotlandSenegalSerbiaSierra LeoneSingaporeSomaliaSouth AfricaSouth AmericaSouth Central AsiaSouth Eastern AsiaSouthern EuropeSpainSri LankaSt. Vincent and the GrenadinesSudanSwedenSwitzerlandSyriaTaiwanThailandTrinidad and TobagoTurkeyUgandaUkraineUruguayUzbekistanVenezuelaVietnamWest IndiesWestern AfricaWestern AsiaWestern EuropeYemenZaireZimbabweAzores
Maltese
Race
Ancestry
AfghanAfricanAlaska NativeAlaskan AthabascanAlbanianAleutAlsatianAmericanApacheArabArapahoArgentineanArmenianAssyrian/Chaldean/SyriacAustralianAustrianBahamianBangladeshiBarbadianBasqueBelgianBelizeanBermudanBhutaneseBlackfeetBolivianBrazilianBritishBritish West IndianBulgarianBurmeseCajunCambodianCanadianCape VerdeanCarpatho RusynCelticCentral AmericanCentral American IndianCherokeeCheyenneChickasawChileanChineseChippewaChoctawColombianColvilleComancheCosta RicanCreeCreekCroatianCrowCubanCypriotCzechCzechoslovakianDanishDelawareDominicanDutchDutch West IndianEastern EuropeanEcuadorianEgyptianEnglishEstonianEthiopianEuropeanFijianFilipinoFinnishFrenchFrench American IndianFrench CanadianGermanGerman RussianGhanaianGreekGuamanian/ChamorroGuatemalanGuyaneseHaitianHmongHonduranHopiHoumaHungarianIcelanderIndian (Asian)IndonesianInupiatIranianIraqiIrishIroquoisIsraeliItalianJamaicanJapaneseJordanianKenyanKiowaKoreanLaotianLatvianLebaneseLiberianLithuanianLumbeeLuxembourgerMacedonianMalteseMarshalleseMenomineeMexicanMexican American IndianMongolianMoroccanNative HawaiianNavajoNepaleseNew ZealanderNicaraguanNigerianNorthern EuropeanNorwegianOkinawanOsageOttawaPaiutePakistaniPalestinianPanamanianParaguayanPennsylvania GermanPeruvianPimaPolishPortuguesePotawatomiPuebloPuerto RicanPuget Sound SalishRomanianRussianSalvadoranSamoanScandinavianScotch-IrishScottishSeminoleSenegaleseSerbianShoshoneSierra LeoneanSiouxSlavicSlovakSloveneSomaliSouth AfricanSouth AmericanSouth American IndianSoviet UnionSpaniardSpanishSpanish AmericanSpanish American IndianSri LankanSubsaharan AfricanSudaneseSwedishSwissSyrianTaiwaneseThaiTlingit-HaidaTohono O'OdhamTonganTrinidadian and TobagonianTsimshianTurkishU.S. Virgin IslanderUgandanUkrainianUruguayanUteVenezuelanVietnameseWelshWest IndianYakamaYaquiYugoslavianYumanYup'ikZimbabwean
Immigration
NonimmigrantsImmigrantsAfghanistanAfricaAlbaniaArgentinaArmeniaAsiaAustraliaAustriaBahamasBangladeshBarbadosBelarusBelgiumBelizeBoliviaBosnia and HerzegovinaBrazilBulgariaBurma/MyanmarCabo VerdeCambodiaCameroonCanadaCaribbeanCentral AmericaChileChinaColombiaCongoCosta RicaCroatiaCubaCzechoslovakiaDenmarkDominicaDominican RepublicEastern AfricaEastern AsiaEastern EuropeEcuadorEgyptEl SalvadorEnglandEritreaEthiopiaEuropeFijiFranceGermanyGhanaGreeceGrenadaGuatemalaGuyanaHaitiHondurasHong KongHungaryIndiaIndonesiaIranIraqIrelandIsraelItalyJamaicaJapanJordanKazakhstanKenyaKoreaKuwaitLaosLatin AmericaLatviaLebanonLiberiaLithuaniaMalaysiaMexicoMicronesiaMiddle AfricaMoldovaMoroccoNepalNetherlandsNicaraguaNigeriaNorth AmericaNorth MacedoniaNorthern AfricaNorthern EuropeNorwayOceaniaPakistanPanamaPeruPhilippinesPolandPortugalRomaniaRussiaSaudi ArabiaScotlandSenegalSerbiaSierra LeoneSingaporeSomaliaSouth AfricaSouth AmericaSouth Central AsiaSouth Eastern AsiaSouthern EuropeSpainSri LankaSt. Vincent and the GrenadinesSudanSwedenSwitzerlandSyriaTaiwanThailandTrinidad and TobagoTurkeyUgandaUkraineUruguayUzbekistanVenezuelaVietnamWest IndiesWestern AfricaWestern AsiaWestern EuropeYemenZaireZimbabweAzores
Male Poverty
Income
Poverty
Unemployment
Labor Participation
Family Structure
Vehicle Availability
Education Level
Disability

Male Poverty Comparison

Malaysians

Maltese

Tragic
Exceptional
12.0%
MALE POVERTY
5.2/ 100
METRIC RATING
207th/ 347
METRIC RANK
9.1%
MALE POVERTY
100.0/ 100
METRIC RATING
5th/ 347
METRIC RANK

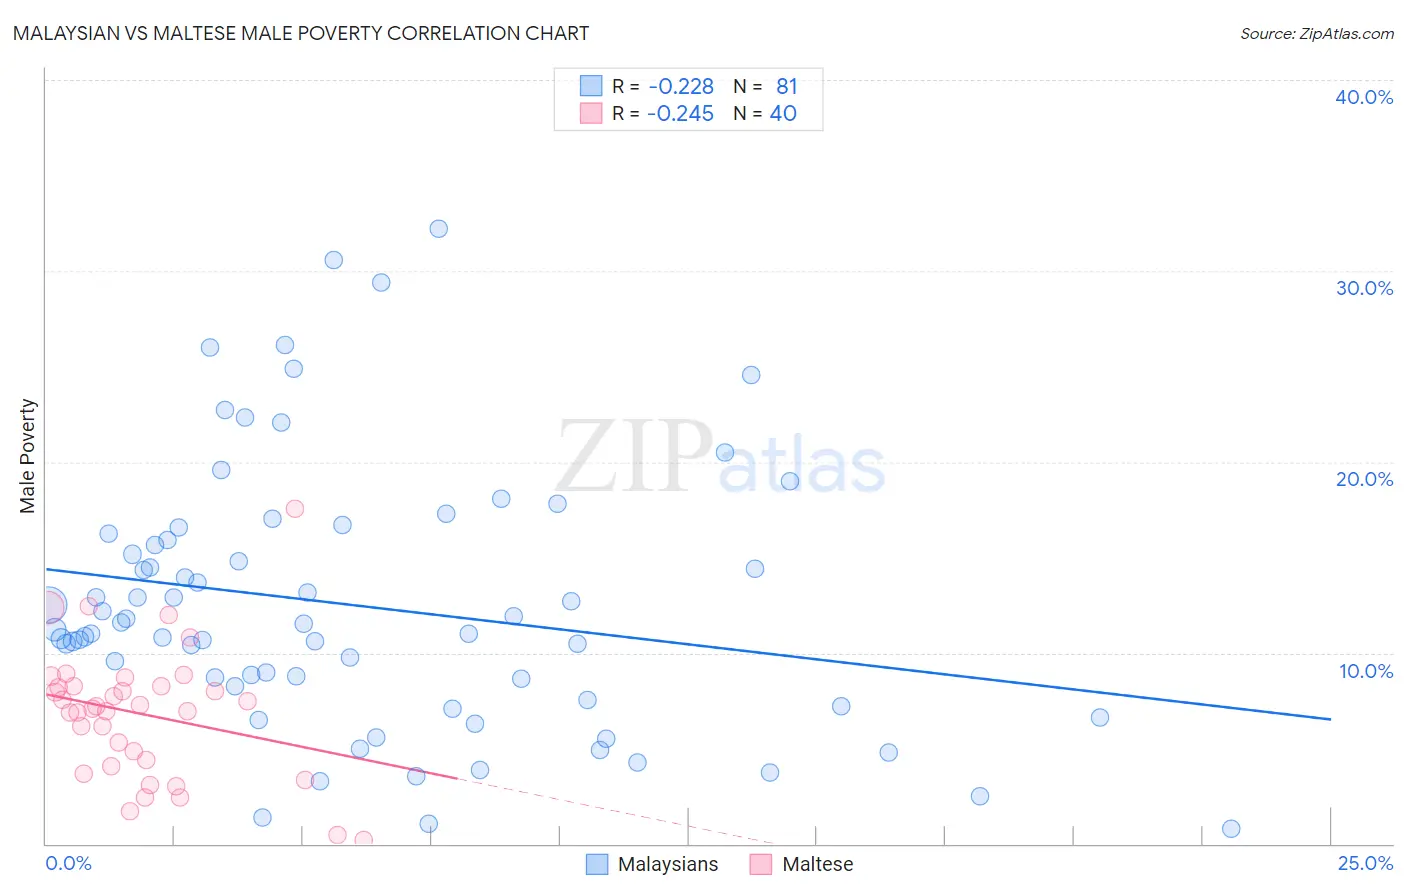
Malaysian vs Maltese Male Poverty Correlation Chart

The statistical analysis conducted on geographies consisting of 225,986,127 people shows a weak negative correlation between the proportion of Malaysians and poverty level among males in the United States with a correlation coefficient (R) of -0.228 and weighted average of 12.0%. Similarly, the statistical analysis conducted on geographies consisting of 126,413,393 people shows a weak negative correlation between the proportion of Maltese and poverty level among males in the United States with a correlation coefficient (R) of -0.245 and weighted average of 9.1%, a difference of 32.1%.
Malaysian vs Maltese Male Poverty

Male Poverty Correlation Summary

MeasurementMalaysianMaltese
Minimum0.78%0.22%
Maximum32.2%17.6%
Range31.4%17.3%
Mean12.5%6.8%
Median11.2%7.1%
Interquartile 25% (IQ1)7.9%4.2%
Interquartile 75% (IQ3)16.1%8.3%
Interquartile Range (IQR)8.2%4.1%
Standard Deviation (Sample)6.9%3.5%
Standard Deviation (Population)6.9%3.4%

Similar Demographics by Male Poverty

Demographics Similar to Malaysians by Male Poverty

In terms of male poverty, the demographic groups most similar to Malaysians are Immigrants from Eastern Africa (12.0%, a difference of 0.10%), Immigrants (12.0%, a difference of 0.33%), Immigrants from the Azores (12.0%, a difference of 0.44%), Panamanian (11.9%, a difference of 0.45%), and Moroccan (12.0%, a difference of 0.50%).
DemographicsRating | RankMale Poverty
Immigrants | Lebanon
13.6
/100
|
#200
Poor
11.7%
Spaniards
13.5
/100
|
#201
Poor
11.7%
Aleuts
10.4
/100
|
#202
Poor
11.8%
Immigrants | Western Asia
9.8
/100
|
#203
Tragic
11.8%
Immigrants | Uganda
8.5
/100
|
#204
Tragic
11.8%
Panamanians
6.2
/100
|
#205
Tragic
11.9%
Immigrants | Eastern Africa
5.4
/100
|
#206
Tragic
12.0%
Malaysians
5.2
/100
|
#207
Tragic
12.0%
Immigrants | Immigrants
4.5
/100
|
#208
Tragic
12.0%
Immigrants | Azores
4.3
/100
|
#209
Tragic
12.0%
Moroccans
4.2
/100
|
#210
Tragic
12.0%
Immigrants | Panama
4.0
/100
|
#211
Tragic
12.1%
Americans
3.2
/100
|
#212
Tragic
12.1%
Immigrants | Nonimmigrants
3.1
/100
|
#213
Tragic
12.1%
Japanese
2.7
/100
|
#214
Tragic
12.2%

Demographics Similar to Maltese by Male Poverty

In terms of male poverty, the demographic groups most similar to Maltese are Assyrian/Chaldean/Syriac (9.1%, a difference of 0.66%), Immigrants from Ireland (9.1%, a difference of 0.75%), Filipino (9.2%, a difference of 1.4%), Immigrants from Taiwan (8.9%, a difference of 2.0%), and Immigrants from South Central Asia (9.3%, a difference of 2.2%).
DemographicsRating | RankMale Poverty
Immigrants | India
100.0
/100
|
#1
Exceptional
8.2%
Chinese
100.0
/100
|
#2
Exceptional
8.7%
Thais
100.0
/100
|
#3
Exceptional
8.7%
Immigrants | Taiwan
100.0
/100
|
#4
Exceptional
8.9%
Maltese
100.0
/100
|
#5
Exceptional
9.1%
Assyrians/Chaldeans/Syriacs
99.9
/100
|
#6
Exceptional
9.1%
Immigrants | Ireland
99.9
/100
|
#7
Exceptional
9.1%
Filipinos
99.9
/100
|
#8
Exceptional
9.2%
Immigrants | South Central Asia
99.9
/100
|
#9
Exceptional
9.3%
Bulgarians
99.9
/100
|
#10
Exceptional
9.3%
Bolivians
99.9
/100
|
#11
Exceptional
9.4%
Immigrants | Bolivia
99.9
/100
|
#12
Exceptional
9.4%
Immigrants | Lithuania
99.9
/100
|
#13
Exceptional
9.4%
Immigrants | North Macedonia
99.8
/100
|
#14
Exceptional
9.4%
Bhutanese
99.8
/100
|
#15
Exceptional
9.5%