Macedonian vs Immigrants from Middle Africa Child Poverty Under the Age of 16
COMPARE
Macedonian
Immigrants from Middle Africa
Child Poverty Under the Age of 16
Child Poverty Under the Age of 16 Comparison
Macedonians
Immigrants from Middle Africa
14.4%
CHILD POVERTY UNDER THE AGE OF 16
97.6/ 100
METRIC RATING
74th/ 347
METRIC RANK
19.0%
CHILD POVERTY UNDER THE AGE OF 16
0.3/ 100
METRIC RATING
250th/ 347
METRIC RANK
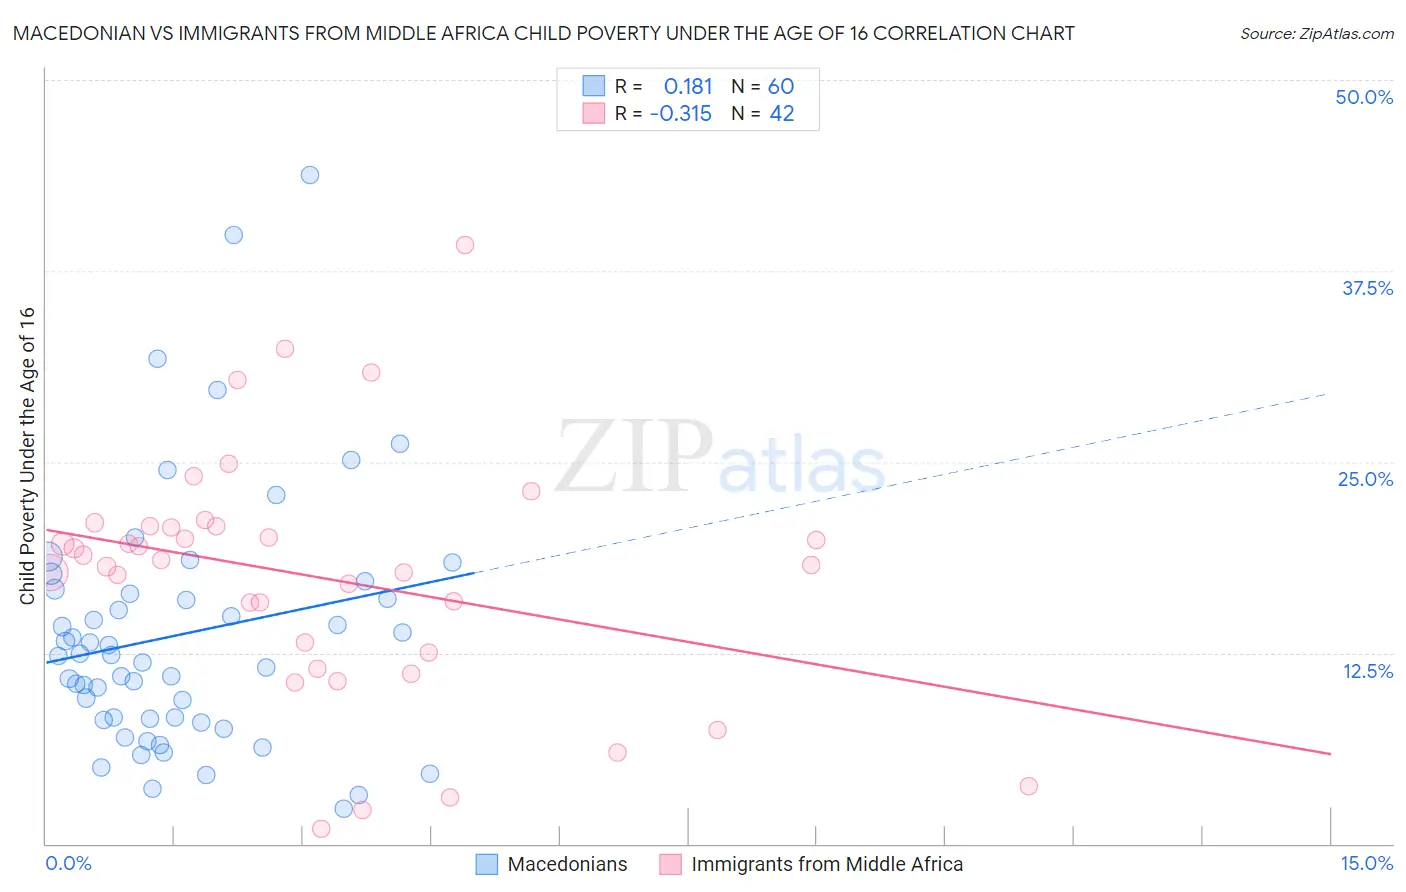
Macedonian vs Immigrants from Middle Africa Child Poverty Under the Age of 16 Correlation Chart
The statistical analysis conducted on geographies consisting of 131,993,313 people shows a poor positive correlation between the proportion of Macedonians and poverty level among children under the age of 16 in the United States with a correlation coefficient (R) of 0.181 and weighted average of 14.4%. Similarly, the statistical analysis conducted on geographies consisting of 202,234,084 people shows a mild negative correlation between the proportion of Immigrants from Middle Africa and poverty level among children under the age of 16 in the United States with a correlation coefficient (R) of -0.315 and weighted average of 19.0%, a difference of 32.2%.
Child Poverty Under the Age of 16 Correlation Summary
| Measurement | Macedonian | Immigrants from Middle Africa |
| Minimum | 2.3% | 0.99% |
| Maximum | 43.8% | 39.2% |
| Range | 41.4% | 38.2% |
| Mean | 13.7% | 17.4% |
| Median | 12.3% | 18.4% |
| Interquartile 25% (IQ1) | 8.1% | 12.5% |
| Interquartile 75% (IQ3) | 16.5% | 20.8% |
| Interquartile Range (IQR) | 8.4% | 8.3% |
| Standard Deviation (Sample) | 8.3% | 8.0% |
| Standard Deviation (Population) | 8.2% | 7.9% |
Similar Demographics by Child Poverty Under the Age of 16
Demographics Similar to Macedonians by Child Poverty Under the Age of 16
In terms of child poverty under the age of 16, the demographic groups most similar to Macedonians are Immigrants from Turkey (14.4%, a difference of 0.0%), Ukrainian (14.4%, a difference of 0.20%), Cambodian (14.4%, a difference of 0.21%), Immigrants from Eastern Europe (14.4%, a difference of 0.21%), and Australian (14.4%, a difference of 0.24%).
| Demographics | Rating | Rank | Child Poverty Under the Age of 16 |
| Europeans | 98.1 /100 | #67 | Exceptional 14.3% |
| Laotians | 98.0 /100 | #68 | Exceptional 14.3% |
| Immigrants | Bulgaria | 98.0 /100 | #69 | Exceptional 14.3% |
| Immigrants | Netherlands | 97.9 /100 | #70 | Exceptional 14.3% |
| Immigrants | Poland | 97.9 /100 | #71 | Exceptional 14.3% |
| Cambodians | 97.8 /100 | #72 | Exceptional 14.4% |
| Immigrants | Turkey | 97.6 /100 | #73 | Exceptional 14.4% |
| Macedonians | 97.6 /100 | #74 | Exceptional 14.4% |
| Ukrainians | 97.5 /100 | #75 | Exceptional 14.4% |
| Immigrants | Eastern Europe | 97.5 /100 | #76 | Exceptional 14.4% |
| Australians | 97.5 /100 | #77 | Exceptional 14.4% |
| Immigrants | Russia | 97.3 /100 | #78 | Exceptional 14.5% |
| Swiss | 97.3 /100 | #79 | Exceptional 14.5% |
| Immigrants | North Macedonia | 97.2 /100 | #80 | Exceptional 14.5% |
| Finns | 97.2 /100 | #81 | Exceptional 14.5% |
Demographics Similar to Immigrants from Middle Africa by Child Poverty Under the Age of 16
In terms of child poverty under the age of 16, the demographic groups most similar to Immigrants from Middle Africa are Immigrants from Ghana (19.1%, a difference of 0.16%), Potawatomi (19.0%, a difference of 0.20%), Immigrants from Trinidad and Tobago (19.1%, a difference of 0.23%), Ecuadorian (19.0%, a difference of 0.39%), and Salvadoran (19.1%, a difference of 0.42%).
| Demographics | Rating | Rank | Child Poverty Under the Age of 16 |
| Immigrants | Cuba | 0.6 /100 | #243 | Tragic 18.7% |
| Cape Verdeans | 0.6 /100 | #244 | Tragic 18.7% |
| Shoshone | 0.5 /100 | #245 | Tragic 18.8% |
| Immigrants | Nicaragua | 0.4 /100 | #246 | Tragic 18.8% |
| French American Indians | 0.4 /100 | #247 | Tragic 18.9% |
| Ecuadorians | 0.3 /100 | #248 | Tragic 19.0% |
| Potawatomi | 0.3 /100 | #249 | Tragic 19.0% |
| Immigrants | Middle Africa | 0.3 /100 | #250 | Tragic 19.0% |
| Immigrants | Ghana | 0.3 /100 | #251 | Tragic 19.1% |
| Immigrants | Trinidad and Tobago | 0.3 /100 | #252 | Tragic 19.1% |
| Salvadorans | 0.3 /100 | #253 | Tragic 19.1% |
| Immigrants | Western Africa | 0.2 /100 | #254 | Tragic 19.2% |
| Trinidadians and Tobagonians | 0.2 /100 | #255 | Tragic 19.2% |
| Inupiat | 0.2 /100 | #256 | Tragic 19.2% |
| Ottawa | 0.2 /100 | #257 | Tragic 19.2% |