Macedonian vs African Child Poverty Under the Age of 16

COMPARE

Macedonian
Race
Ancestry
AfghanAlaska NativeAlaskan AthabascanAlbanianAleutAlsatianAmericanApacheArabArapahoArgentineanArmenianAssyrian/Chaldean/SyriacAustralianAustrianBahamianBangladeshiBarbadianBasqueBelgianBelizeanBermudanBhutaneseBlackfeetBolivianBrazilianBritishBritish West IndianBulgarianBurmeseCajunCambodianCanadianCape VerdeanCarpatho RusynCelticCentral AmericanCentral American IndianCherokeeCheyenneChickasawChileanChineseChippewaChoctawColombianColvilleComancheCosta RicanCreeCreekCroatianCrowCubanCypriotCzechCzechoslovakianDanishDelawareDominicanDutchDutch West IndianEastern EuropeanEcuadorianEgyptianEnglishEstonianEthiopianEuropeanFijianFilipinoFinnishFrenchFrench American IndianFrench CanadianGermanGerman RussianGhanaianGreekGuamanian/ChamorroGuatemalanGuyaneseHaitianHmongHonduranHopiHoumaHungarianIcelanderIndian (Asian)IndonesianInupiatIranianIraqiIrishIroquoisIsraeliItalianJamaicanJapaneseJordanianKenyanKiowaKoreanLaotianLatvianLebaneseLiberianLithuanianLumbeeLuxembourgerMacedonianMalaysianMalteseMarshalleseMenomineeMexicanMexican American IndianMongolianMoroccanNative HawaiianNavajoNepaleseNew ZealanderNicaraguanNigerianNorthern EuropeanNorwegianOkinawanOsageOttawaPaiutePakistaniPalestinianPanamanianParaguayanPennsylvania GermanPeruvianPimaPolishPortuguesePotawatomiPuebloPuerto RicanPuget Sound SalishRomanianRussianSalvadoranSamoanScandinavianScotch-IrishScottishSeminoleSenegaleseSerbianShoshoneSierra LeoneanSiouxSlavicSlovakSloveneSomaliSouth AfricanSouth AmericanSouth American IndianSoviet UnionSpaniardSpanishSpanish AmericanSpanish American IndianSri LankanSubsaharan AfricanSudaneseSwedishSwissSyrianTaiwaneseThaiTlingit-HaidaTohono O'OdhamTonganTrinidadian and TobagonianTsimshianTurkishU.S. Virgin IslanderUgandanUkrainianUruguayanUteVenezuelanVietnameseWelshWest IndianYakamaYaquiYugoslavianYumanYup'ikZimbabwean
Immigration
NonimmigrantsImmigrantsAfghanistanAfricaAlbaniaArgentinaArmeniaAsiaAustraliaAustriaBahamasBangladeshBarbadosBelarusBelgiumBelizeBoliviaBosnia and HerzegovinaBrazilBulgariaBurma/MyanmarCabo VerdeCambodiaCameroonCanadaCaribbeanCentral AmericaChileChinaColombiaCongoCosta RicaCroatiaCubaCzechoslovakiaDenmarkDominicaDominican RepublicEastern AfricaEastern AsiaEastern EuropeEcuadorEgyptEl SalvadorEnglandEritreaEthiopiaEuropeFijiFranceGermanyGhanaGreeceGrenadaGuatemalaGuyanaHaitiHondurasHong KongHungaryIndiaIndonesiaIranIraqIrelandIsraelItalyJamaicaJapanJordanKazakhstanKenyaKoreaKuwaitLaosLatin AmericaLatviaLebanonLiberiaLithuaniaMalaysiaMexicoMicronesiaMiddle AfricaMoldovaMoroccoNepalNetherlandsNicaraguaNigeriaNorth AmericaNorth MacedoniaNorthern AfricaNorthern EuropeNorwayOceaniaPakistanPanamaPeruPhilippinesPolandPortugalRomaniaRussiaSaudi ArabiaScotlandSenegalSerbiaSierra LeoneSingaporeSomaliaSouth AfricaSouth AmericaSouth Central AsiaSouth Eastern AsiaSouthern EuropeSpainSri LankaSt. Vincent and the GrenadinesSudanSwedenSwitzerlandSyriaTaiwanThailandTrinidad and TobagoTurkeyUgandaUkraineUruguayUzbekistanVenezuelaVietnamWest IndiesWestern AfricaWestern AsiaWestern EuropeYemenZaireZimbabweAzores
African
Race
Ancestry
AfghanAfricanAlaska NativeAlaskan AthabascanAlbanianAleutAlsatianAmericanApacheArabArapahoArgentineanArmenianAssyrian/Chaldean/SyriacAustralianAustrianBahamianBangladeshiBarbadianBasqueBelgianBelizeanBermudanBhutaneseBlackfeetBolivianBrazilianBritishBritish West IndianBulgarianBurmeseCajunCambodianCanadianCape VerdeanCarpatho RusynCelticCentral AmericanCentral American IndianCherokeeCheyenneChickasawChileanChineseChippewaChoctawColombianColvilleComancheCosta RicanCreeCreekCroatianCrowCubanCypriotCzechCzechoslovakianDanishDelawareDominicanDutchDutch West IndianEastern EuropeanEcuadorianEgyptianEnglishEstonianEthiopianEuropeanFijianFilipinoFinnishFrenchFrench American IndianFrench CanadianGermanGerman RussianGhanaianGreekGuamanian/ChamorroGuatemalanGuyaneseHaitianHmongHonduranHopiHoumaHungarianIcelanderIndian (Asian)IndonesianInupiatIranianIraqiIrishIroquoisIsraeliItalianJamaicanJapaneseJordanianKenyanKiowaKoreanLaotianLatvianLebaneseLiberianLithuanianLumbeeLuxembourgerMalaysianMalteseMarshalleseMenomineeMexicanMexican American IndianMongolianMoroccanNative HawaiianNavajoNepaleseNew ZealanderNicaraguanNigerianNorthern EuropeanNorwegianOkinawanOsageOttawaPaiutePakistaniPalestinianPanamanianParaguayanPennsylvania GermanPeruvianPimaPolishPortuguesePotawatomiPuebloPuerto RicanPuget Sound SalishRomanianRussianSalvadoranSamoanScandinavianScotch-IrishScottishSeminoleSenegaleseSerbianShoshoneSierra LeoneanSiouxSlavicSlovakSloveneSomaliSouth AfricanSouth AmericanSouth American IndianSoviet UnionSpaniardSpanishSpanish AmericanSpanish American IndianSri LankanSubsaharan AfricanSudaneseSwedishSwissSyrianTaiwaneseThaiTlingit-HaidaTohono O'OdhamTonganTrinidadian and TobagonianTsimshianTurkishU.S. Virgin IslanderUgandanUkrainianUruguayanUteVenezuelanVietnameseWelshWest IndianYakamaYaquiYugoslavianYumanYup'ikZimbabwean
Immigration
NonimmigrantsImmigrantsAfghanistanAfricaAlbaniaArgentinaArmeniaAsiaAustraliaAustriaBahamasBangladeshBarbadosBelarusBelgiumBelizeBoliviaBosnia and HerzegovinaBrazilBulgariaBurma/MyanmarCabo VerdeCambodiaCameroonCanadaCaribbeanCentral AmericaChileChinaColombiaCongoCosta RicaCroatiaCubaCzechoslovakiaDenmarkDominicaDominican RepublicEastern AfricaEastern AsiaEastern EuropeEcuadorEgyptEl SalvadorEnglandEritreaEthiopiaEuropeFijiFranceGermanyGhanaGreeceGrenadaGuatemalaGuyanaHaitiHondurasHong KongHungaryIndiaIndonesiaIranIraqIrelandIsraelItalyJamaicaJapanJordanKazakhstanKenyaKoreaKuwaitLaosLatin AmericaLatviaLebanonLiberiaLithuaniaMalaysiaMexicoMicronesiaMiddle AfricaMoldovaMoroccoNepalNetherlandsNicaraguaNigeriaNorth AmericaNorth MacedoniaNorthern AfricaNorthern EuropeNorwayOceaniaPakistanPanamaPeruPhilippinesPolandPortugalRomaniaRussiaSaudi ArabiaScotlandSenegalSerbiaSierra LeoneSingaporeSomaliaSouth AfricaSouth AmericaSouth Central AsiaSouth Eastern AsiaSouthern EuropeSpainSri LankaSt. Vincent and the GrenadinesSudanSwedenSwitzerlandSyriaTaiwanThailandTrinidad and TobagoTurkeyUgandaUkraineUruguayUzbekistanVenezuelaVietnamWest IndiesWestern AfricaWestern AsiaWestern EuropeYemenZaireZimbabweAzores
Child Poverty Under the Age of 16
Income
Poverty
Unemployment
Labor Participation
Family Structure
Vehicle Availability
Education Level
Disability

Child Poverty Under the Age of 16 Comparison

Macedonians

Africans

Exceptional
Tragic
14.4%
CHILD POVERTY UNDER THE AGE OF 16
97.6/ 100
METRIC RATING
74th/ 347
METRIC RANK
21.7%
CHILD POVERTY UNDER THE AGE OF 16
0.0/ 100
METRIC RATING
316th/ 347
METRIC RANK

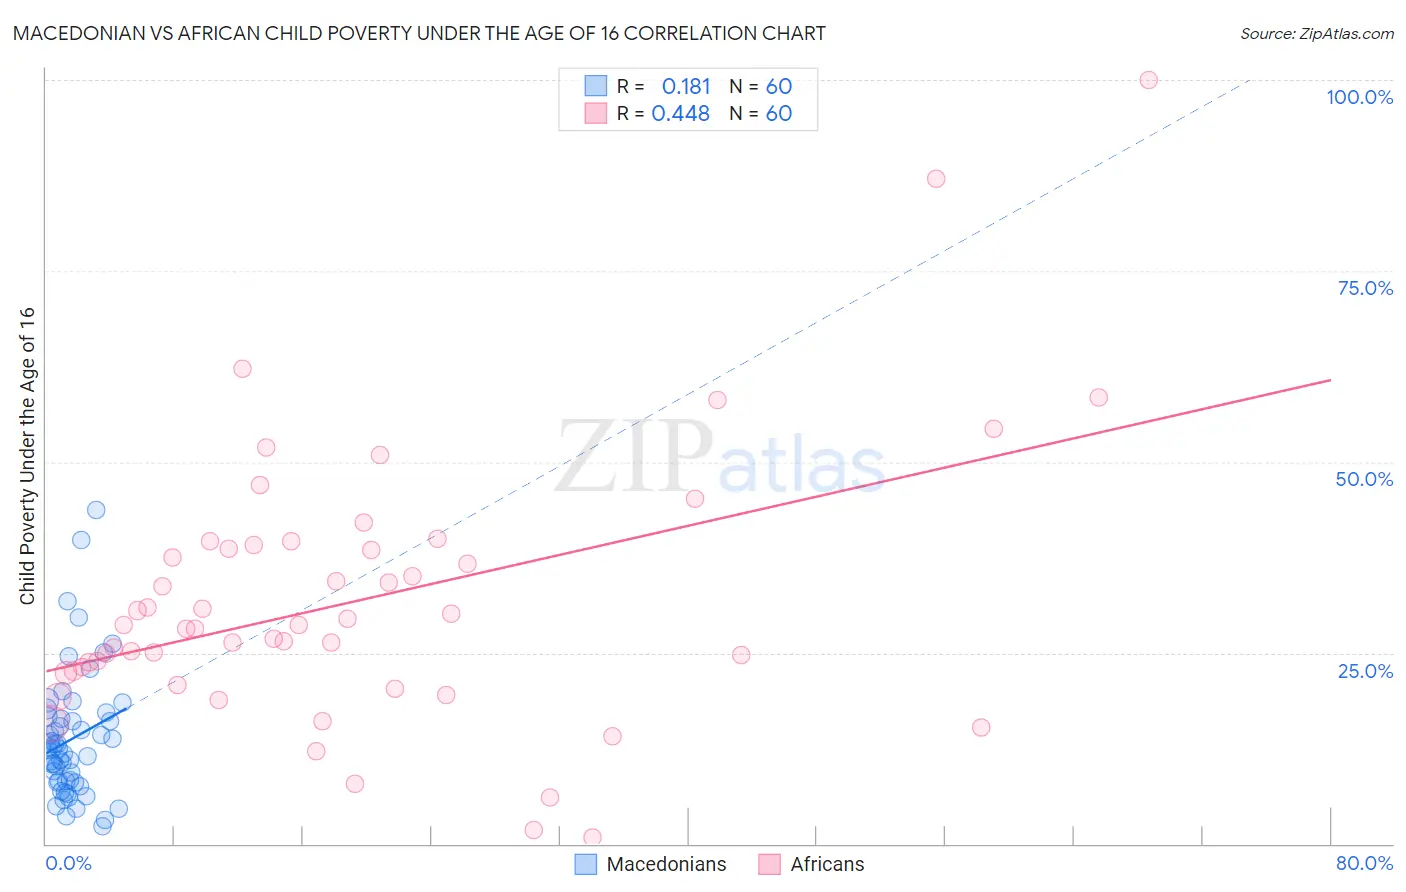
Macedonian vs African Child Poverty Under the Age of 16 Correlation Chart

The statistical analysis conducted on geographies consisting of 131,993,313 people shows a poor positive correlation between the proportion of Macedonians and poverty level among children under the age of 16 in the United States with a correlation coefficient (R) of 0.181 and weighted average of 14.4%. Similarly, the statistical analysis conducted on geographies consisting of 466,270,452 people shows a moderate positive correlation between the proportion of Africans and poverty level among children under the age of 16 in the United States with a correlation coefficient (R) of 0.448 and weighted average of 21.7%, a difference of 50.7%.
Macedonian vs African Child Poverty Under the Age of 16

Child Poverty Under the Age of 16 Correlation Summary

MeasurementMacedonianAfrican
Minimum2.3%0.88%
Maximum43.8%100.0%
Range41.4%99.1%
Mean13.7%31.8%
Median12.3%28.4%
Interquartile 25% (IQ1)8.1%22.5%
Interquartile 75% (IQ3)16.5%38.9%
Interquartile Range (IQR)8.4%16.5%
Standard Deviation (Sample)8.3%17.6%
Standard Deviation (Population)8.2%17.5%

Similar Demographics by Child Poverty Under the Age of 16

Demographics Similar to Macedonians by Child Poverty Under the Age of 16

In terms of child poverty under the age of 16, the demographic groups most similar to Macedonians are Immigrants from Turkey (14.4%, a difference of 0.0%), Ukrainian (14.4%, a difference of 0.20%), Cambodian (14.4%, a difference of 0.21%), Immigrants from Eastern Europe (14.4%, a difference of 0.21%), and Australian (14.4%, a difference of 0.24%).
DemographicsRating | RankChild Poverty Under the Age of 16
Europeans
98.1
/100
|
#67
Exceptional
14.3%
Laotians
98.0
/100
|
#68
Exceptional
14.3%
Immigrants | Bulgaria
98.0
/100
|
#69
Exceptional
14.3%
Immigrants | Netherlands
97.9
/100
|
#70
Exceptional
14.3%
Immigrants | Poland
97.9
/100
|
#71
Exceptional
14.3%
Cambodians
97.8
/100
|
#72
Exceptional
14.4%
Immigrants | Turkey
97.6
/100
|
#73
Exceptional
14.4%
Macedonians
97.6
/100
|
#74
Exceptional
14.4%
Ukrainians
97.5
/100
|
#75
Exceptional
14.4%
Immigrants | Eastern Europe
97.5
/100
|
#76
Exceptional
14.4%
Australians
97.5
/100
|
#77
Exceptional
14.4%
Immigrants | Russia
97.3
/100
|
#78
Exceptional
14.5%
Swiss
97.3
/100
|
#79
Exceptional
14.5%
Immigrants | North Macedonia
97.2
/100
|
#80
Exceptional
14.5%
Finns
97.2
/100
|
#81
Exceptional
14.5%

Demographics Similar to Africans by Child Poverty Under the Age of 16

In terms of child poverty under the age of 16, the demographic groups most similar to Africans are Immigrants from Guatemala (21.6%, a difference of 0.42%), Immigrants from Somalia (21.6%, a difference of 0.56%), Creek (21.5%, a difference of 0.76%), Immigrants from Dominica (21.9%, a difference of 0.77%), and Ute (21.5%, a difference of 0.79%).
DemographicsRating | RankChild Poverty Under the Age of 16
Immigrants | Mexico
0.0
/100
|
#309
Tragic
21.5%
Bahamians
0.0
/100
|
#310
Tragic
21.5%
Dutch West Indians
0.0
/100
|
#311
Tragic
21.5%
Ute
0.0
/100
|
#312
Tragic
21.5%
Creek
0.0
/100
|
#313
Tragic
21.5%
Immigrants | Somalia
0.0
/100
|
#314
Tragic
21.6%
Immigrants | Guatemala
0.0
/100
|
#315
Tragic
21.6%
Africans
0.0
/100
|
#316
Tragic
21.7%
Immigrants | Dominica
0.0
/100
|
#317
Tragic
21.9%
U.S. Virgin Islanders
0.0
/100
|
#318
Tragic
22.0%
Yakama
0.0
/100
|
#319
Tragic
22.1%
Cajuns
0.0
/100
|
#320
Tragic
22.1%
Kiowa
0.0
/100
|
#321
Tragic
22.2%
Hondurans
0.0
/100
|
#322
Tragic
22.2%
Paiute
0.0
/100
|
#323
Tragic
22.4%