Lebanese vs Honduran Single Mother Poverty

COMPARE

Lebanese
Race
Ancestry
AfghanAfricanAlaska NativeAlaskan AthabascanAlbanianAleutAlsatianAmericanApacheArabArapahoArgentineanArmenianAssyrian/Chaldean/SyriacAustralianAustrianBahamianBangladeshiBarbadianBasqueBelgianBelizeanBermudanBhutaneseBlackfeetBolivianBrazilianBritishBritish West IndianBulgarianBurmeseCajunCambodianCanadianCape VerdeanCarpatho RusynCelticCentral AmericanCentral American IndianCherokeeCheyenneChickasawChileanChineseChippewaChoctawColombianColvilleComancheCosta RicanCreeCreekCroatianCrowCubanCypriotCzechCzechoslovakianDanishDelawareDominicanDutchDutch West IndianEastern EuropeanEcuadorianEgyptianEnglishEstonianEthiopianEuropeanFijianFilipinoFinnishFrenchFrench American IndianFrench CanadianGermanGerman RussianGhanaianGreekGuamanian/ChamorroGuatemalanGuyaneseHaitianHmongHopiHoumaHungarianIcelanderIndian (Asian)IndonesianInupiatIranianIraqiIrishIroquoisIsraeliItalianJamaicanJapaneseJordanianKenyanKiowaKoreanLaotianLatvianLebaneseLiberianLithuanianLumbeeLuxembourgerMacedonianMalaysianMalteseMarshalleseMenomineeMexicanMexican American IndianMongolianMoroccanNative HawaiianNavajoNepaleseNew ZealanderNicaraguanNigerianNorthern EuropeanNorwegianOkinawanOsageOttawaPaiutePakistaniPalestinianPanamanianParaguayanPennsylvania GermanPeruvianPimaPolishPortuguesePotawatomiPuebloPuerto RicanPuget Sound SalishRomanianRussianSalvadoranSamoanScandinavianScotch-IrishScottishSeminoleSenegaleseSerbianShoshoneSierra LeoneanSiouxSlavicSlovakSloveneSomaliSouth AfricanSouth AmericanSouth American IndianSoviet UnionSpaniardSpanishSpanish AmericanSpanish American IndianSri LankanSubsaharan AfricanSudaneseSwedishSwissSyrianTaiwaneseThaiTlingit-HaidaTohono O'OdhamTonganTrinidadian and TobagonianTsimshianTurkishU.S. Virgin IslanderUgandanUkrainianUruguayanUteVenezuelanVietnameseWelshWest IndianYakamaYaquiYugoslavianYumanYup'ikZimbabwean
Immigration
NonimmigrantsImmigrantsAfghanistanAfricaAlbaniaArgentinaArmeniaAsiaAustraliaAustriaBahamasBangladeshBarbadosBelarusBelgiumBelizeBoliviaBosnia and HerzegovinaBrazilBulgariaBurma/MyanmarCabo VerdeCambodiaCameroonCanadaCaribbeanCentral AmericaChileChinaColombiaCongoCosta RicaCroatiaCubaCzechoslovakiaDenmarkDominicaDominican RepublicEastern AfricaEastern AsiaEastern EuropeEcuadorEgyptEl SalvadorEnglandEritreaEthiopiaEuropeFijiFranceGermanyGhanaGreeceGrenadaGuatemalaGuyanaHaitiHondurasHong KongHungaryIndiaIndonesiaIranIraqIrelandIsraelItalyJamaicaJapanJordanKazakhstanKenyaKoreaKuwaitLaosLatin AmericaLatviaLebanonLiberiaLithuaniaMalaysiaMexicoMicronesiaMiddle AfricaMoldovaMoroccoNepalNetherlandsNicaraguaNigeriaNorth AmericaNorth MacedoniaNorthern AfricaNorthern EuropeNorwayOceaniaPakistanPanamaPeruPhilippinesPolandPortugalRomaniaRussiaSaudi ArabiaScotlandSenegalSerbiaSierra LeoneSingaporeSomaliaSouth AfricaSouth AmericaSouth Central AsiaSouth Eastern AsiaSouthern EuropeSpainSri LankaSt. Vincent and the GrenadinesSudanSwedenSwitzerlandSyriaTaiwanThailandTrinidad and TobagoTurkeyUgandaUkraineUruguayUzbekistanVenezuelaVietnamWest IndiesWestern AfricaWestern AsiaWestern EuropeYemenZaireZimbabweAzores
Honduran
Race
Ancestry
AfghanAfricanAlaska NativeAlaskan AthabascanAlbanianAleutAlsatianAmericanApacheArabArapahoArgentineanArmenianAssyrian/Chaldean/SyriacAustralianAustrianBahamianBangladeshiBarbadianBasqueBelgianBelizeanBermudanBhutaneseBlackfeetBolivianBrazilianBritishBritish West IndianBulgarianBurmeseCajunCambodianCanadianCape VerdeanCarpatho RusynCelticCentral AmericanCentral American IndianCherokeeCheyenneChickasawChileanChineseChippewaChoctawColombianColvilleComancheCosta RicanCreeCreekCroatianCrowCubanCypriotCzechCzechoslovakianDanishDelawareDominicanDutchDutch West IndianEastern EuropeanEcuadorianEgyptianEnglishEstonianEthiopianEuropeanFijianFilipinoFinnishFrenchFrench American IndianFrench CanadianGermanGerman RussianGhanaianGreekGuamanian/ChamorroGuatemalanGuyaneseHaitianHmongHonduranHopiHoumaHungarianIcelanderIndian (Asian)IndonesianInupiatIranianIraqiIrishIroquoisIsraeliItalianJamaicanJapaneseJordanianKenyanKiowaKoreanLaotianLatvianLiberianLithuanianLumbeeLuxembourgerMacedonianMalaysianMalteseMarshalleseMenomineeMexicanMexican American IndianMongolianMoroccanNative HawaiianNavajoNepaleseNew ZealanderNicaraguanNigerianNorthern EuropeanNorwegianOkinawanOsageOttawaPaiutePakistaniPalestinianPanamanianParaguayanPennsylvania GermanPeruvianPimaPolishPortuguesePotawatomiPuebloPuerto RicanPuget Sound SalishRomanianRussianSalvadoranSamoanScandinavianScotch-IrishScottishSeminoleSenegaleseSerbianShoshoneSierra LeoneanSiouxSlavicSlovakSloveneSomaliSouth AfricanSouth AmericanSouth American IndianSoviet UnionSpaniardSpanishSpanish AmericanSpanish American IndianSri LankanSubsaharan AfricanSudaneseSwedishSwissSyrianTaiwaneseThaiTlingit-HaidaTohono O'OdhamTonganTrinidadian and TobagonianTsimshianTurkishU.S. Virgin IslanderUgandanUkrainianUruguayanUteVenezuelanVietnameseWelshWest IndianYakamaYaquiYugoslavianYumanYup'ikZimbabwean
Immigration
NonimmigrantsImmigrantsAfghanistanAfricaAlbaniaArgentinaArmeniaAsiaAustraliaAustriaBahamasBangladeshBarbadosBelarusBelgiumBelizeBoliviaBosnia and HerzegovinaBrazilBulgariaBurma/MyanmarCabo VerdeCambodiaCameroonCanadaCaribbeanCentral AmericaChileChinaColombiaCongoCosta RicaCroatiaCubaCzechoslovakiaDenmarkDominicaDominican RepublicEastern AfricaEastern AsiaEastern EuropeEcuadorEgyptEl SalvadorEnglandEritreaEthiopiaEuropeFijiFranceGermanyGhanaGreeceGrenadaGuatemalaGuyanaHaitiHondurasHong KongHungaryIndiaIndonesiaIranIraqIrelandIsraelItalyJamaicaJapanJordanKazakhstanKenyaKoreaKuwaitLaosLatin AmericaLatviaLebanonLiberiaLithuaniaMalaysiaMexicoMicronesiaMiddle AfricaMoldovaMoroccoNepalNetherlandsNicaraguaNigeriaNorth AmericaNorth MacedoniaNorthern AfricaNorthern EuropeNorwayOceaniaPakistanPanamaPeruPhilippinesPolandPortugalRomaniaRussiaSaudi ArabiaScotlandSenegalSerbiaSierra LeoneSingaporeSomaliaSouth AfricaSouth AmericaSouth Central AsiaSouth Eastern AsiaSouthern EuropeSpainSri LankaSt. Vincent and the GrenadinesSudanSwedenSwitzerlandSyriaTaiwanThailandTrinidad and TobagoTurkeyUgandaUkraineUruguayUzbekistanVenezuelaVietnamWest IndiesWestern AfricaWestern AsiaWestern EuropeYemenZaireZimbabweAzores
Single Mother Poverty
Income
Poverty
Unemployment
Labor Participation
Family Structure
Vehicle Availability
Education Level
Disability

Single Mother Poverty Comparison

Lebanese

Hondurans

Fair
Tragic
29.4%
SINGLE MOTHER POVERTY
32.5/ 100
METRIC RATING
187th/ 347
METRIC RANK
34.2%
SINGLE MOTHER POVERTY
0.0/ 100
METRIC RATING
310th/ 347
METRIC RANK

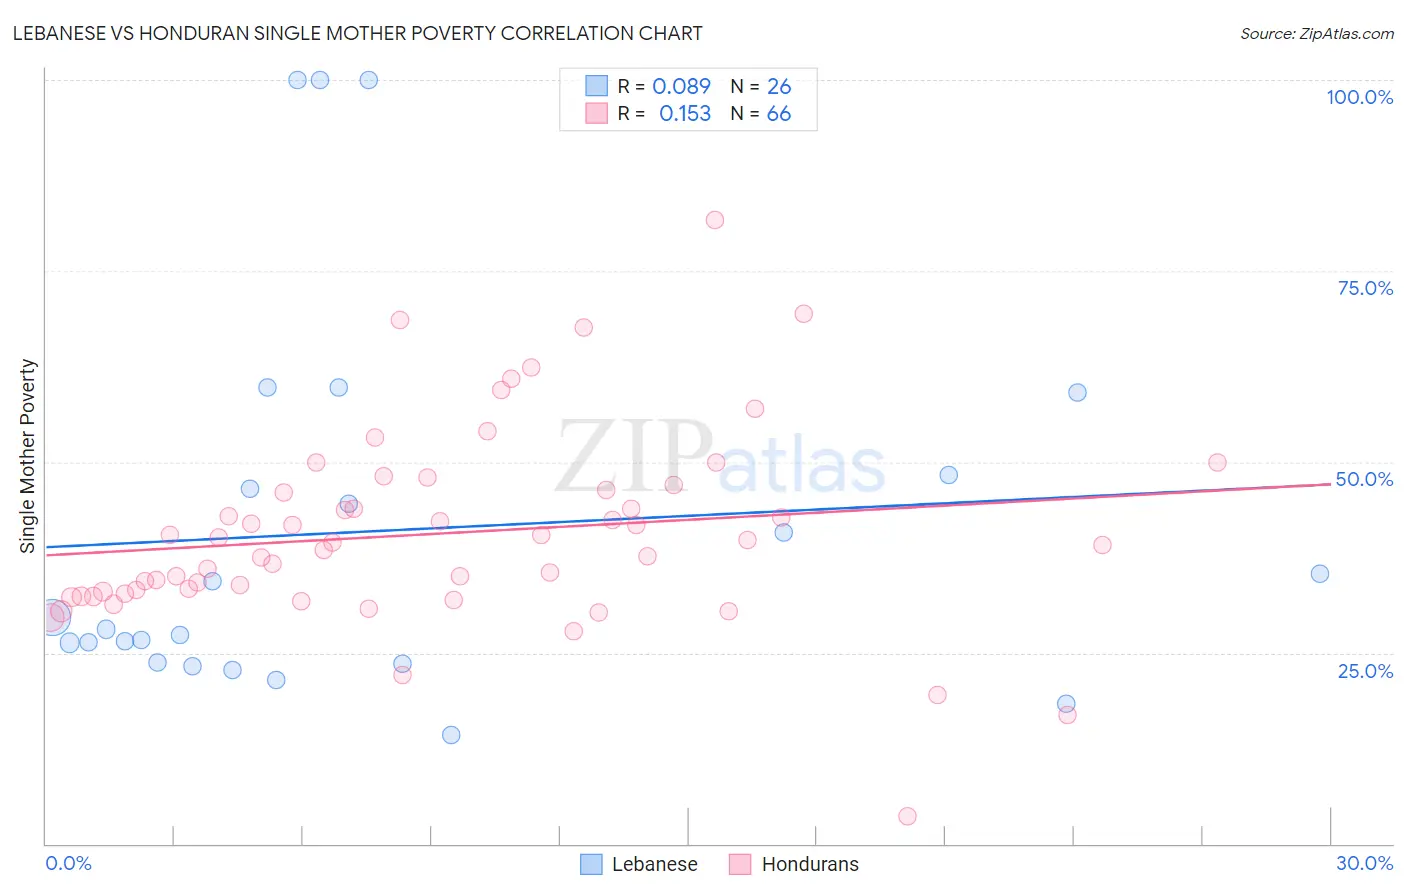
Lebanese vs Honduran Single Mother Poverty Correlation Chart

The statistical analysis conducted on geographies consisting of 390,539,511 people shows a slight positive correlation between the proportion of Lebanese and poverty level among single mothers in the United States with a correlation coefficient (R) of 0.089 and weighted average of 29.4%. Similarly, the statistical analysis conducted on geographies consisting of 352,983,929 people shows a poor positive correlation between the proportion of Hondurans and poverty level among single mothers in the United States with a correlation coefficient (R) of 0.153 and weighted average of 34.2%, a difference of 16.3%.
Lebanese vs Honduran Single Mother Poverty

Single Mother Poverty Correlation Summary

MeasurementLebaneseHonduran
Minimum14.3%3.6%
Maximum100.0%81.7%
Range85.7%78.2%
Mean41.0%40.6%
Median28.9%39.2%
Interquartile 25% (IQ1)23.8%32.8%
Interquartile 75% (IQ3)48.2%46.3%
Interquartile Range (IQR)24.4%13.5%
Standard Deviation (Sample)25.2%12.9%
Standard Deviation (Population)24.7%12.8%

Similar Demographics by Single Mother Poverty

Demographics Similar to Lebanese by Single Mother Poverty

In terms of single mother poverty, the demographic groups most similar to Lebanese are Guamanian/Chamorro (29.4%, a difference of 0.040%), Immigrants from Africa (29.4%, a difference of 0.050%), Immigrants from Germany (29.5%, a difference of 0.11%), Immigrants from Trinidad and Tobago (29.5%, a difference of 0.18%), and Yugoslavian (29.4%, a difference of 0.19%).
DemographicsRating | RankSingle Mother Poverty
Immigrants | Norway
41.5
/100
|
#180
Average
29.3%
Canadians
40.4
/100
|
#181
Average
29.3%
Immigrants | Eastern Africa
38.5
/100
|
#182
Fair
29.3%
Nepalese
38.3
/100
|
#183
Fair
29.3%
Nigerians
38.0
/100
|
#184
Fair
29.3%
Ghanaians
36.8
/100
|
#185
Fair
29.4%
Yugoslavians
36.0
/100
|
#186
Fair
29.4%
Lebanese
32.5
/100
|
#187
Fair
29.4%
Guamanians/Chamorros
31.8
/100
|
#188
Fair
29.4%
Immigrants | Africa
31.6
/100
|
#189
Fair
29.4%
Immigrants | Germany
30.4
/100
|
#190
Fair
29.5%
Immigrants | Trinidad and Tobago
29.2
/100
|
#191
Fair
29.5%
Moroccans
28.6
/100
|
#192
Fair
29.5%
Basques
28.3
/100
|
#193
Fair
29.5%
Icelanders
26.1
/100
|
#194
Fair
29.5%

Demographics Similar to Hondurans by Single Mother Poverty

In terms of single mother poverty, the demographic groups most similar to Hondurans are Potawatomi (34.1%, a difference of 0.22%), Alsatian (34.3%, a difference of 0.31%), Central American Indian (34.3%, a difference of 0.39%), Immigrants from Dominican Republic (34.4%, a difference of 0.47%), and Immigrants from Mexico (34.0%, a difference of 0.64%).
DemographicsRating | RankSingle Mother Poverty
Americans
0.0
/100
|
#303
Tragic
33.5%
Mexicans
0.0
/100
|
#304
Tragic
33.6%
Immigrants | Central America
0.0
/100
|
#305
Tragic
33.6%
Immigrants | Congo
0.0
/100
|
#306
Tragic
33.8%
Comanche
0.0
/100
|
#307
Tragic
33.9%
Immigrants | Mexico
0.0
/100
|
#308
Tragic
34.0%
Potawatomi
0.0
/100
|
#309
Tragic
34.1%
Hondurans
0.0
/100
|
#310
Tragic
34.2%
Alsatians
0.0
/100
|
#311
Tragic
34.3%
Central American Indians
0.0
/100
|
#312
Tragic
34.3%
Immigrants | Dominican Republic
0.0
/100
|
#313
Tragic
34.4%
Chickasaw
0.0
/100
|
#314
Tragic
34.4%
Hopi
0.0
/100
|
#315
Tragic
34.5%
Dominicans
0.0
/100
|
#316
Tragic
34.5%
Cherokee
0.0
/100
|
#317
Tragic
34.5%