Laotian vs Moroccan Male Poverty
COMPARE
Laotian
Moroccan
Male Poverty
Male Poverty Comparison
Laotians
Moroccans
10.5%
MALE POVERTY
91.2/ 100
METRIC RATING
107th/ 347
METRIC RANK
12.0%
MALE POVERTY
4.2/ 100
METRIC RATING
210th/ 347
METRIC RANK
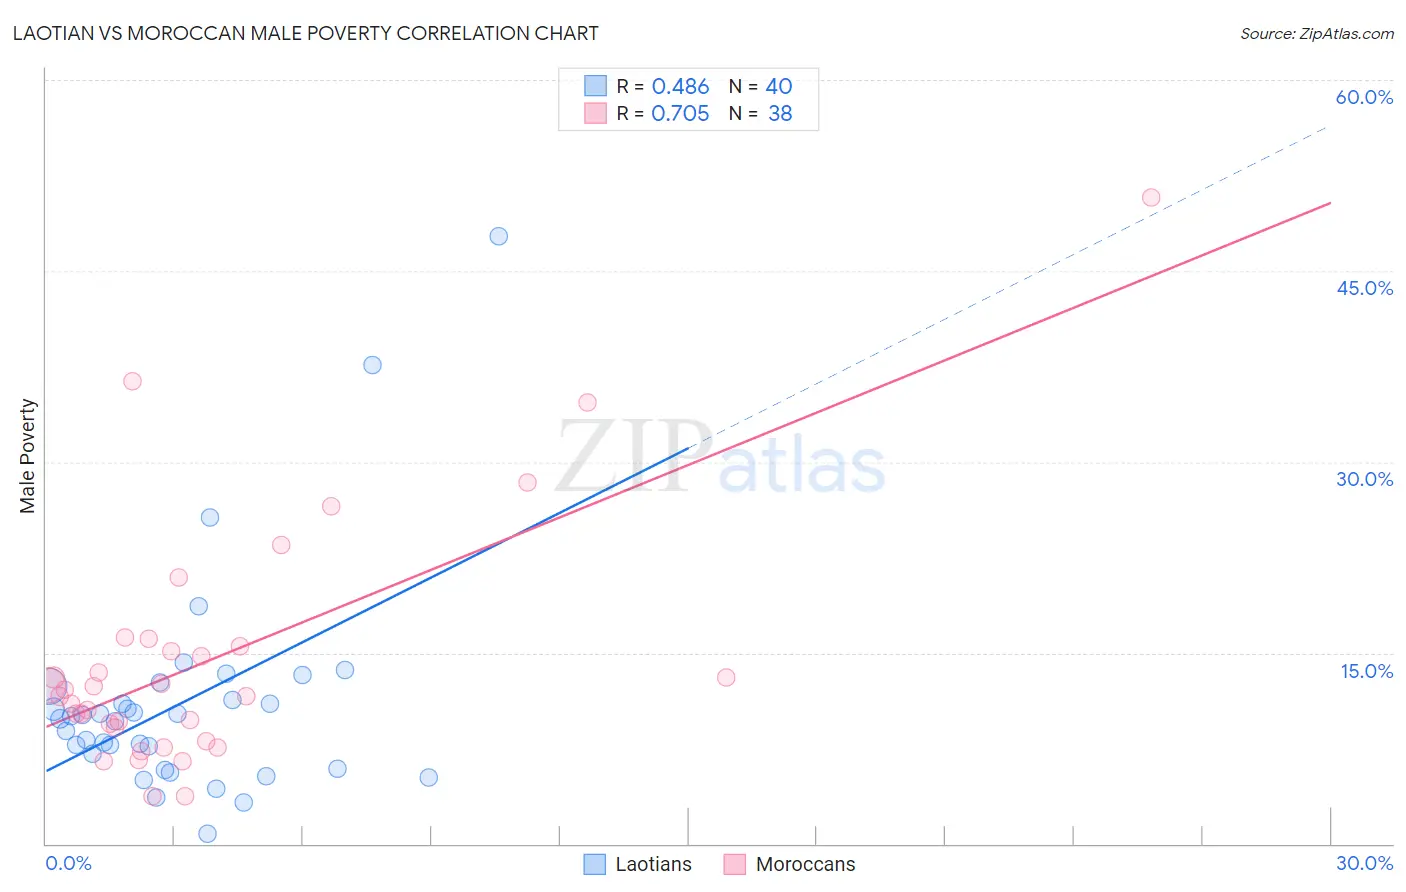
Laotian vs Moroccan Male Poverty Correlation Chart
The statistical analysis conducted on geographies consisting of 224,721,860 people shows a moderate positive correlation between the proportion of Laotians and poverty level among males in the United States with a correlation coefficient (R) of 0.486 and weighted average of 10.5%. Similarly, the statistical analysis conducted on geographies consisting of 201,723,684 people shows a strong positive correlation between the proportion of Moroccans and poverty level among males in the United States with a correlation coefficient (R) of 0.705 and weighted average of 12.0%, a difference of 14.2%.
Male Poverty Correlation Summary
| Measurement | Laotian | Moroccan |
| Minimum | 0.78% | 3.7% |
| Maximum | 47.7% | 50.7% |
| Range | 46.9% | 47.0% |
| Mean | 11.0% | 14.4% |
| Median | 9.9% | 11.8% |
| Interquartile 25% (IQ1) | 6.5% | 9.1% |
| Interquartile 75% (IQ3) | 11.8% | 15.5% |
| Interquartile Range (IQR) | 5.4% | 6.4% |
| Standard Deviation (Sample) | 8.6% | 9.7% |
| Standard Deviation (Population) | 8.5% | 9.6% |
Similar Demographics by Male Poverty
Demographics Similar to Laotians by Male Poverty
In terms of male poverty, the demographic groups most similar to Laotians are Immigrants from Southern Europe (10.5%, a difference of 0.010%), Portuguese (10.6%, a difference of 0.070%), Canadian (10.5%, a difference of 0.12%), Welsh (10.5%, a difference of 0.13%), and Slavic (10.5%, a difference of 0.14%).
| Demographics | Rating | Rank | Male Poverty |
| Immigrants | Latvia | 92.8 /100 | #100 | Exceptional 10.5% |
| Immigrants | Zimbabwe | 92.0 /100 | #101 | Exceptional 10.5% |
| French Canadians | 91.9 /100 | #102 | Exceptional 10.5% |
| Slavs | 91.7 /100 | #103 | Exceptional 10.5% |
| Welsh | 91.6 /100 | #104 | Exceptional 10.5% |
| Canadians | 91.6 /100 | #105 | Exceptional 10.5% |
| Immigrants | Southern Europe | 91.3 /100 | #106 | Exceptional 10.5% |
| Laotians | 91.2 /100 | #107 | Exceptional 10.5% |
| Portuguese | 91.0 /100 | #108 | Exceptional 10.6% |
| Albanians | 90.6 /100 | #109 | Exceptional 10.6% |
| Argentineans | 90.1 /100 | #110 | Exceptional 10.6% |
| Immigrants | Argentina | 89.8 /100 | #111 | Excellent 10.6% |
| Immigrants | Turkey | 89.5 /100 | #112 | Excellent 10.6% |
| Palestinians | 89.1 /100 | #113 | Excellent 10.6% |
| Immigrants | Brazil | 89.0 /100 | #114 | Excellent 10.6% |
Demographics Similar to Moroccans by Male Poverty
In terms of male poverty, the demographic groups most similar to Moroccans are Immigrants from the Azores (12.0%, a difference of 0.050%), Immigrants from Panama (12.1%, a difference of 0.12%), Immigrants (12.0%, a difference of 0.17%), Malaysian (12.0%, a difference of 0.50%), and Immigrants from Eastern Africa (12.0%, a difference of 0.60%).
| Demographics | Rating | Rank | Male Poverty |
| Immigrants | Western Asia | 9.8 /100 | #203 | Tragic 11.8% |
| Immigrants | Uganda | 8.5 /100 | #204 | Tragic 11.8% |
| Panamanians | 6.2 /100 | #205 | Tragic 11.9% |
| Immigrants | Eastern Africa | 5.4 /100 | #206 | Tragic 12.0% |
| Malaysians | 5.2 /100 | #207 | Tragic 12.0% |
| Immigrants | Immigrants | 4.5 /100 | #208 | Tragic 12.0% |
| Immigrants | Azores | 4.3 /100 | #209 | Tragic 12.0% |
| Moroccans | 4.2 /100 | #210 | Tragic 12.0% |
| Immigrants | Panama | 4.0 /100 | #211 | Tragic 12.1% |
| Americans | 3.2 /100 | #212 | Tragic 12.1% |
| Immigrants | Nonimmigrants | 3.1 /100 | #213 | Tragic 12.1% |
| Japanese | 2.7 /100 | #214 | Tragic 12.2% |
| Immigrants | Uzbekistan | 2.6 /100 | #215 | Tragic 12.2% |
| Immigrants | Cambodia | 2.5 /100 | #216 | Tragic 12.2% |
| Immigrants | Thailand | 2.5 /100 | #217 | Tragic 12.2% |