Laotian vs Immigrants from Senegal Male Poverty
COMPARE
Laotian
Immigrants from Senegal
Male Poverty
Male Poverty Comparison
Laotians
Immigrants from Senegal
10.5%
MALE POVERTY
91.2/ 100
METRIC RATING
107th/ 347
METRIC RANK
14.0%
MALE POVERTY
0.0/ 100
METRIC RATING
301st/ 347
METRIC RANK
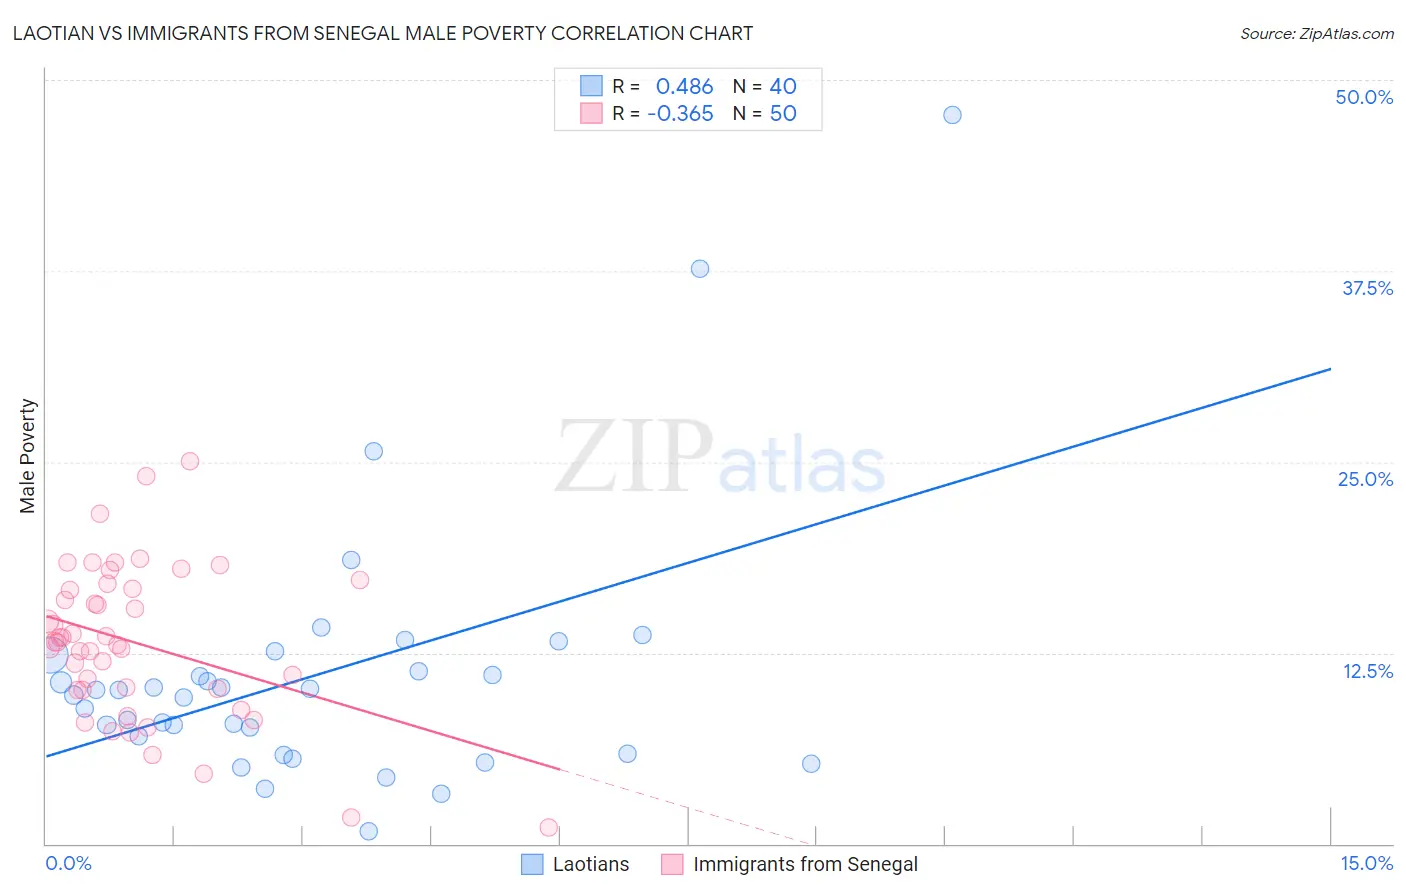
Laotian vs Immigrants from Senegal Male Poverty Correlation Chart
The statistical analysis conducted on geographies consisting of 224,721,860 people shows a moderate positive correlation between the proportion of Laotians and poverty level among males in the United States with a correlation coefficient (R) of 0.486 and weighted average of 10.5%. Similarly, the statistical analysis conducted on geographies consisting of 90,120,671 people shows a mild negative correlation between the proportion of Immigrants from Senegal and poverty level among males in the United States with a correlation coefficient (R) of -0.365 and weighted average of 14.0%, a difference of 33.1%.
Male Poverty Correlation Summary
| Measurement | Laotian | Immigrants from Senegal |
| Minimum | 0.78% | 1.1% |
| Maximum | 47.7% | 25.1% |
| Range | 46.9% | 24.0% |
| Mean | 11.0% | 13.1% |
| Median | 9.9% | 13.2% |
| Interquartile 25% (IQ1) | 6.5% | 10.0% |
| Interquartile 75% (IQ3) | 11.8% | 16.7% |
| Interquartile Range (IQR) | 5.4% | 6.7% |
| Standard Deviation (Sample) | 8.6% | 5.1% |
| Standard Deviation (Population) | 8.5% | 5.0% |
Similar Demographics by Male Poverty
Demographics Similar to Laotians by Male Poverty
In terms of male poverty, the demographic groups most similar to Laotians are Immigrants from Southern Europe (10.5%, a difference of 0.010%), Portuguese (10.6%, a difference of 0.070%), Canadian (10.5%, a difference of 0.12%), Welsh (10.5%, a difference of 0.13%), and Slavic (10.5%, a difference of 0.14%).
| Demographics | Rating | Rank | Male Poverty |
| Immigrants | Latvia | 92.8 /100 | #100 | Exceptional 10.5% |
| Immigrants | Zimbabwe | 92.0 /100 | #101 | Exceptional 10.5% |
| French Canadians | 91.9 /100 | #102 | Exceptional 10.5% |
| Slavs | 91.7 /100 | #103 | Exceptional 10.5% |
| Welsh | 91.6 /100 | #104 | Exceptional 10.5% |
| Canadians | 91.6 /100 | #105 | Exceptional 10.5% |
| Immigrants | Southern Europe | 91.3 /100 | #106 | Exceptional 10.5% |
| Laotians | 91.2 /100 | #107 | Exceptional 10.5% |
| Portuguese | 91.0 /100 | #108 | Exceptional 10.6% |
| Albanians | 90.6 /100 | #109 | Exceptional 10.6% |
| Argentineans | 90.1 /100 | #110 | Exceptional 10.6% |
| Immigrants | Argentina | 89.8 /100 | #111 | Excellent 10.6% |
| Immigrants | Turkey | 89.5 /100 | #112 | Excellent 10.6% |
| Palestinians | 89.1 /100 | #113 | Excellent 10.6% |
| Immigrants | Brazil | 89.0 /100 | #114 | Excellent 10.6% |
Demographics Similar to Immigrants from Senegal by Male Poverty
In terms of male poverty, the demographic groups most similar to Immigrants from Senegal are Immigrants from Caribbean (14.0%, a difference of 0.060%), Immigrants from Mexico (14.0%, a difference of 0.070%), Bahamian (14.1%, a difference of 0.10%), Immigrants from Guatemala (14.0%, a difference of 0.18%), and Senegalese (14.1%, a difference of 0.20%).
| Demographics | Rating | Rank | Male Poverty |
| Hispanics or Latinos | 0.0 /100 | #294 | Tragic 13.9% |
| Immigrants | Central America | 0.0 /100 | #295 | Tragic 13.9% |
| Cajuns | 0.0 /100 | #296 | Tragic 13.9% |
| Inupiat | 0.0 /100 | #297 | Tragic 14.0% |
| Blackfeet | 0.0 /100 | #298 | Tragic 14.0% |
| Immigrants | Guatemala | 0.0 /100 | #299 | Tragic 14.0% |
| Immigrants | Mexico | 0.0 /100 | #300 | Tragic 14.0% |
| Immigrants | Senegal | 0.0 /100 | #301 | Tragic 14.0% |
| Immigrants | Caribbean | 0.0 /100 | #302 | Tragic 14.0% |
| Bahamians | 0.0 /100 | #303 | Tragic 14.1% |
| Senegalese | 0.0 /100 | #304 | Tragic 14.1% |
| Immigrants | Bangladesh | 0.0 /100 | #305 | Tragic 14.1% |
| Creek | 0.0 /100 | #306 | Tragic 14.1% |
| Dutch West Indians | 0.0 /100 | #307 | Tragic 14.2% |
| Africans | 0.0 /100 | #308 | Tragic 14.2% |