Kiowa vs Bolivian Child Poverty Under the Age of 5

COMPARE

Kiowa
Race
Ancestry
AfghanAfricanAlaska NativeAlaskan AthabascanAlbanianAleutAlsatianAmericanApacheArabArapahoArgentineanArmenianAssyrian/Chaldean/SyriacAustralianAustrianBahamianBangladeshiBarbadianBasqueBelgianBelizeanBermudanBhutaneseBlackfeetBrazilianBritishBritish West IndianBulgarianBurmeseCajunCambodianCanadianCape VerdeanCarpatho RusynCelticCentral AmericanCentral American IndianCherokeeCheyenneChickasawChileanChineseChippewaChoctawColombianColvilleComancheCosta RicanCreeCreekCroatianCrowCubanCypriotCzechCzechoslovakianDanishDelawareDominicanDutchDutch West IndianEastern EuropeanEcuadorianEgyptianEnglishEstonianEthiopianEuropeanFijianFilipinoFinnishFrenchFrench American IndianFrench CanadianGermanGerman RussianGhanaianGreekGuamanian/ChamorroGuatemalanGuyaneseHaitianHmongHonduranHopiHoumaHungarianIcelanderIndian (Asian)IndonesianInupiatIranianIraqiIrishIroquoisIsraeliItalianJamaicanJapaneseJordanianKenyanKiowaKoreanLaotianLatvianLebaneseLiberianLithuanianLumbeeLuxembourgerMacedonianMalaysianMalteseMarshalleseMenomineeMexicanMexican American IndianMongolianMoroccanNative HawaiianNavajoNepaleseNew ZealanderNicaraguanNigerianNorthern EuropeanNorwegianOkinawanOsageOttawaPaiutePakistaniPalestinianPanamanianParaguayanPennsylvania GermanPeruvianPimaPolishPortuguesePotawatomiPuebloPuerto RicanPuget Sound SalishRomanianRussianSalvadoranSamoanScandinavianScotch-IrishScottishSeminoleSenegaleseSerbianShoshoneSierra LeoneanSiouxSlavicSlovakSloveneSomaliSouth AfricanSouth AmericanSouth American IndianSoviet UnionSpaniardSpanishSpanish AmericanSpanish American IndianSri LankanSubsaharan AfricanSudaneseSwedishSwissSyrianTaiwaneseThaiTlingit-HaidaTohono O'OdhamTonganTrinidadian and TobagonianTsimshianTurkishU.S. Virgin IslanderUgandanUkrainianUruguayanUteVenezuelanVietnameseWelshWest IndianYakamaYaquiYugoslavianYumanYup'ikZimbabwean
Immigration
NonimmigrantsImmigrantsAfghanistanAfricaAlbaniaArgentinaArmeniaAsiaAustraliaAustriaBahamasBangladeshBarbadosBelarusBelgiumBelizeBoliviaBosnia and HerzegovinaBrazilBulgariaBurma/MyanmarCabo VerdeCambodiaCameroonCanadaCaribbeanCentral AmericaChileChinaColombiaCongoCosta RicaCroatiaCubaCzechoslovakiaDenmarkDominicaDominican RepublicEastern AfricaEastern AsiaEastern EuropeEcuadorEgyptEl SalvadorEnglandEritreaEthiopiaEuropeFijiFranceGermanyGhanaGreeceGrenadaGuatemalaGuyanaHaitiHondurasHong KongHungaryIndiaIndonesiaIranIraqIrelandIsraelItalyJamaicaJapanJordanKazakhstanKenyaKoreaKuwaitLaosLatin AmericaLatviaLebanonLiberiaLithuaniaMalaysiaMexicoMicronesiaMiddle AfricaMoldovaMoroccoNepalNetherlandsNicaraguaNigeriaNorth AmericaNorth MacedoniaNorthern AfricaNorthern EuropeNorwayOceaniaPakistanPanamaPeruPhilippinesPolandPortugalRomaniaRussiaSaudi ArabiaScotlandSenegalSerbiaSierra LeoneSingaporeSomaliaSouth AfricaSouth AmericaSouth Central AsiaSouth Eastern AsiaSouthern EuropeSpainSri LankaSt. Vincent and the GrenadinesSudanSwedenSwitzerlandSyriaTaiwanThailandTrinidad and TobagoTurkeyUgandaUkraineUruguayUzbekistanVenezuelaVietnamWest IndiesWestern AfricaWestern AsiaWestern EuropeYemenZaireZimbabweAzores
Bolivian
Race
Ancestry
AfghanAfricanAlaska NativeAlaskan AthabascanAlbanianAleutAlsatianAmericanApacheArabArapahoArgentineanArmenianAssyrian/Chaldean/SyriacAustralianAustrianBahamianBangladeshiBarbadianBasqueBelgianBelizeanBermudanBhutaneseBlackfeetBolivianBrazilianBritishBritish West IndianBulgarianBurmeseCajunCambodianCanadianCape VerdeanCarpatho RusynCelticCentral AmericanCentral American IndianCherokeeCheyenneChickasawChileanChineseChippewaChoctawColombianColvilleComancheCosta RicanCreeCreekCroatianCrowCubanCypriotCzechCzechoslovakianDanishDelawareDominicanDutchDutch West IndianEastern EuropeanEcuadorianEgyptianEnglishEstonianEthiopianEuropeanFijianFilipinoFinnishFrenchFrench American IndianFrench CanadianGermanGerman RussianGhanaianGreekGuamanian/ChamorroGuatemalanGuyaneseHaitianHmongHonduranHopiHoumaHungarianIcelanderIndian (Asian)IndonesianInupiatIranianIraqiIrishIroquoisIsraeliItalianJamaicanJapaneseJordanianKenyanKoreanLaotianLatvianLebaneseLiberianLithuanianLumbeeLuxembourgerMacedonianMalaysianMalteseMarshalleseMenomineeMexicanMexican American IndianMongolianMoroccanNative HawaiianNavajoNepaleseNew ZealanderNicaraguanNigerianNorthern EuropeanNorwegianOkinawanOsageOttawaPaiutePakistaniPalestinianPanamanianParaguayanPennsylvania GermanPeruvianPimaPolishPortuguesePotawatomiPuebloPuerto RicanPuget Sound SalishRomanianRussianSalvadoranSamoanScandinavianScotch-IrishScottishSeminoleSenegaleseSerbianShoshoneSierra LeoneanSiouxSlavicSlovakSloveneSomaliSouth AfricanSouth AmericanSouth American IndianSoviet UnionSpaniardSpanishSpanish AmericanSpanish American IndianSri LankanSubsaharan AfricanSudaneseSwedishSwissSyrianTaiwaneseThaiTlingit-HaidaTohono O'OdhamTonganTrinidadian and TobagonianTsimshianTurkishU.S. Virgin IslanderUgandanUkrainianUruguayanUteVenezuelanVietnameseWelshWest IndianYakamaYaquiYugoslavianYumanYup'ikZimbabwean
Immigration
NonimmigrantsImmigrantsAfghanistanAfricaAlbaniaArgentinaArmeniaAsiaAustraliaAustriaBahamasBangladeshBarbadosBelarusBelgiumBelizeBoliviaBosnia and HerzegovinaBrazilBulgariaBurma/MyanmarCabo VerdeCambodiaCameroonCanadaCaribbeanCentral AmericaChileChinaColombiaCongoCosta RicaCroatiaCubaCzechoslovakiaDenmarkDominicaDominican RepublicEastern AfricaEastern AsiaEastern EuropeEcuadorEgyptEl SalvadorEnglandEritreaEthiopiaEuropeFijiFranceGermanyGhanaGreeceGrenadaGuatemalaGuyanaHaitiHondurasHong KongHungaryIndiaIndonesiaIranIraqIrelandIsraelItalyJamaicaJapanJordanKazakhstanKenyaKoreaKuwaitLaosLatin AmericaLatviaLebanonLiberiaLithuaniaMalaysiaMexicoMicronesiaMiddle AfricaMoldovaMoroccoNepalNetherlandsNicaraguaNigeriaNorth AmericaNorth MacedoniaNorthern AfricaNorthern EuropeNorwayOceaniaPakistanPanamaPeruPhilippinesPolandPortugalRomaniaRussiaSaudi ArabiaScotlandSenegalSerbiaSierra LeoneSingaporeSomaliaSouth AfricaSouth AmericaSouth Central AsiaSouth Eastern AsiaSouthern EuropeSpainSri LankaSt. Vincent and the GrenadinesSudanSwedenSwitzerlandSyriaTaiwanThailandTrinidad and TobagoTurkeyUgandaUkraineUruguayUzbekistanVenezuelaVietnamWest IndiesWestern AfricaWestern AsiaWestern EuropeYemenZaireZimbabweAzores
Child Poverty Under the Age of 5
Income
Poverty
Unemployment
Labor Participation
Family Structure
Vehicle Availability
Education Level
Disability

Child Poverty Under the Age of 5 Comparison

Kiowa

Bolivians

Tragic
Exceptional
24.5%
CHILD POVERTY UNDER THE AGE OF 5
0.0/ 100
METRIC RATING
331st/ 347
METRIC RANK
13.8%
CHILD POVERTY UNDER THE AGE OF 5
100.0/ 100
METRIC RATING
21st/ 347
METRIC RANK

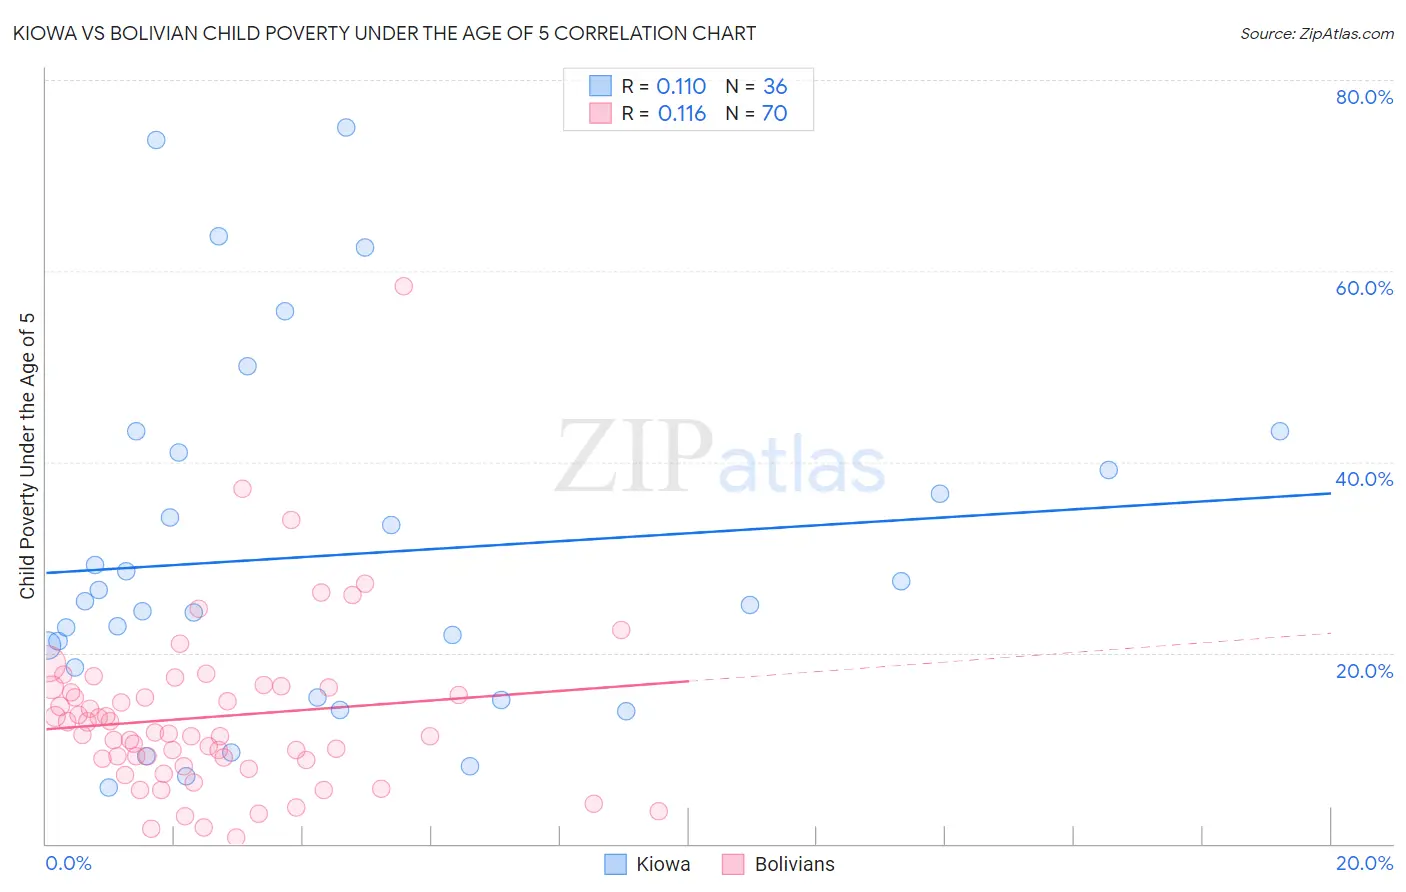
Kiowa vs Bolivian Child Poverty Under the Age of 5 Correlation Chart

The statistical analysis conducted on geographies consisting of 55,875,823 people shows a poor positive correlation between the proportion of Kiowa and poverty level among children under the age of 5 in the United States with a correlation coefficient (R) of 0.110 and weighted average of 24.5%. Similarly, the statistical analysis conducted on geographies consisting of 180,561,858 people shows a poor positive correlation between the proportion of Bolivians and poverty level among children under the age of 5 in the United States with a correlation coefficient (R) of 0.116 and weighted average of 13.8%, a difference of 77.0%.
Kiowa vs Bolivian Child Poverty Under the Age of 5

Child Poverty Under the Age of 5 Correlation Summary

MeasurementKiowaBolivian
Minimum5.8%0.67%
Maximum75.0%58.4%
Range69.2%57.8%
Mean30.2%13.3%
Median25.2%11.4%
Interquartile 25% (IQ1)16.9%8.8%
Interquartile 75% (IQ3)40.1%16.4%
Interquartile Range (IQR)23.2%7.5%
Standard Deviation (Sample)18.4%9.0%
Standard Deviation (Population)18.1%8.9%

Similar Demographics by Child Poverty Under the Age of 5

Demographics Similar to Kiowa by Child Poverty Under the Age of 5

In terms of child poverty under the age of 5, the demographic groups most similar to Kiowa are Creek (24.2%, a difference of 1.0%), Cajun (24.1%, a difference of 1.5%), Immigrants from Dominican Republic (24.1%, a difference of 1.7%), Dominican (24.0%, a difference of 1.8%), and Apache (25.0%, a difference of 2.2%).
DemographicsRating | RankChild Poverty Under the Age of 5
Paiute
0.0
/100
|
#324
Tragic
23.8%
Immigrants | Congo
0.0
/100
|
#325
Tragic
23.9%
Central American Indians
0.0
/100
|
#326
Tragic
23.9%
Dominicans
0.0
/100
|
#327
Tragic
24.0%
Immigrants | Dominican Republic
0.0
/100
|
#328
Tragic
24.1%
Cajuns
0.0
/100
|
#329
Tragic
24.1%
Creek
0.0
/100
|
#330
Tragic
24.2%
Kiowa
0.0
/100
|
#331
Tragic
24.5%
Apache
0.0
/100
|
#332
Tragic
25.0%
Natives/Alaskans
0.0
/100
|
#333
Tragic
25.6%
Blacks/African Americans
0.0
/100
|
#334
Tragic
25.7%
Colville
0.0
/100
|
#335
Tragic
25.7%
Sioux
0.0
/100
|
#336
Tragic
26.9%
Pima
0.0
/100
|
#337
Tragic
27.4%
Hopi
0.0
/100
|
#338
Tragic
27.7%

Demographics Similar to Bolivians by Child Poverty Under the Age of 5

In terms of child poverty under the age of 5, the demographic groups most similar to Bolivians are Immigrants from Bolivia (13.8%, a difference of 0.080%), Immigrants from Japan (13.8%, a difference of 0.30%), Bulgarian (13.9%, a difference of 0.52%), Immigrants from Ireland (13.7%, a difference of 0.70%), and Asian (14.0%, a difference of 1.0%).
DemographicsRating | RankChild Poverty Under the Age of 5
Okinawans
100.0
/100
|
#14
Exceptional
13.4%
Indians (Asian)
100.0
/100
|
#15
Exceptional
13.4%
Immigrants | Eastern Asia
100.0
/100
|
#16
Exceptional
13.5%
Assyrians/Chaldeans/Syriacs
100.0
/100
|
#17
Exceptional
13.6%
Immigrants | China
100.0
/100
|
#18
Exceptional
13.6%
Immigrants | Ireland
100.0
/100
|
#19
Exceptional
13.7%
Immigrants | Japan
100.0
/100
|
#20
Exceptional
13.8%
Bolivians
100.0
/100
|
#21
Exceptional
13.8%
Immigrants | Bolivia
100.0
/100
|
#22
Exceptional
13.8%
Bulgarians
99.9
/100
|
#23
Exceptional
13.9%
Asians
99.9
/100
|
#24
Exceptional
14.0%
Cypriots
99.9
/100
|
#25
Exceptional
14.0%
Immigrants | Lithuania
99.9
/100
|
#26
Exceptional
14.1%
Tongans
99.9
/100
|
#27
Exceptional
14.2%
Immigrants | Indonesia
99.8
/100
|
#28
Exceptional
14.3%