Immigrants from Lithuania vs Bolivian Child Poverty Under the Age of 5
COMPARE
Immigrants from Lithuania
Bolivian
Child Poverty Under the Age of 5
Child Poverty Under the Age of 5 Comparison
Immigrants from Lithuania
Bolivians
14.1%
CHILD POVERTY UNDER THE AGE OF 5
99.9/ 100
METRIC RATING
26th/ 347
METRIC RANK
13.8%
CHILD POVERTY UNDER THE AGE OF 5
100.0/ 100
METRIC RATING
21st/ 347
METRIC RANK
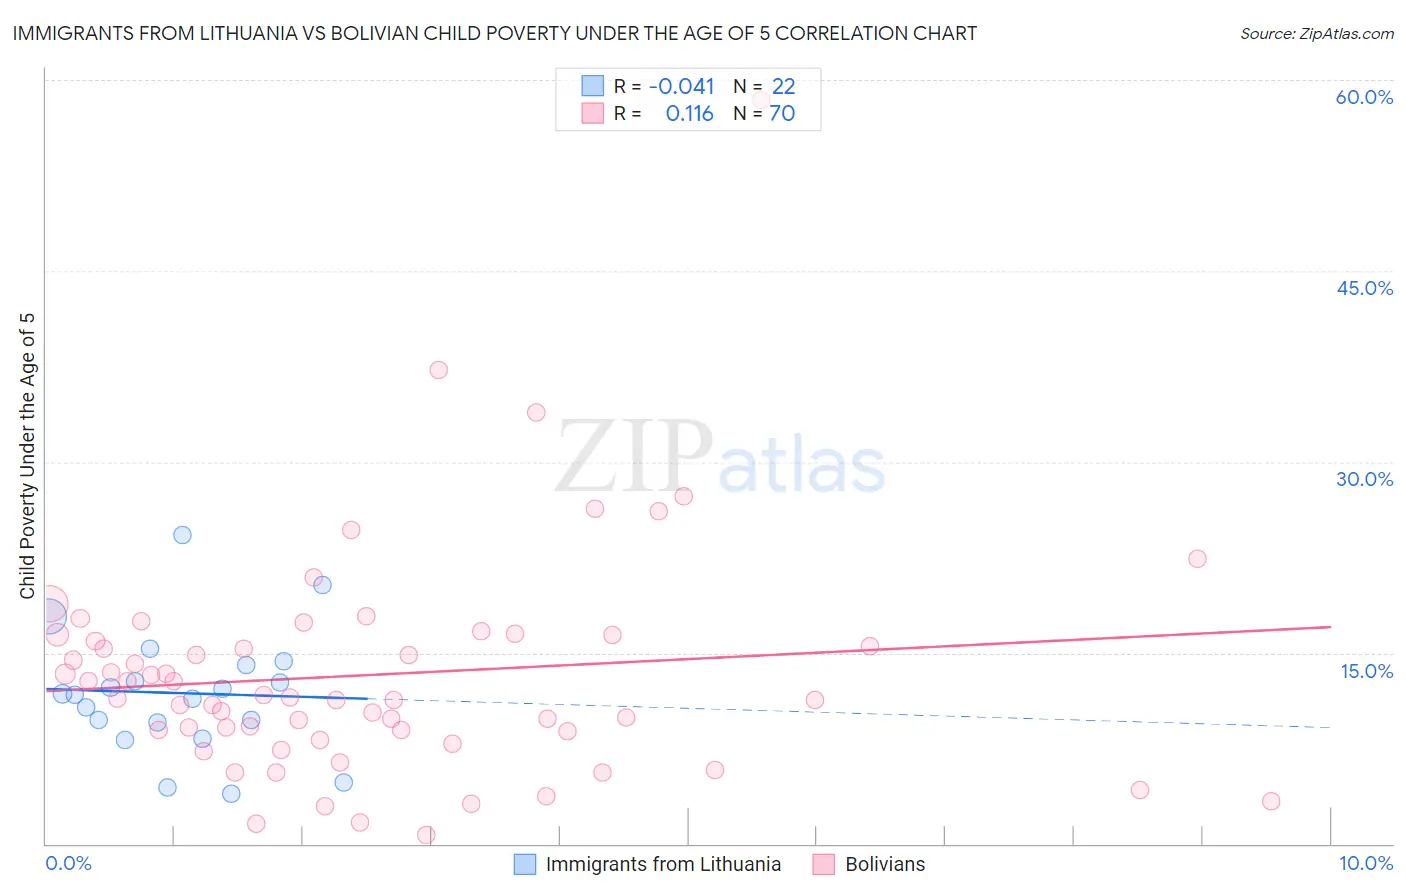
Immigrants from Lithuania vs Bolivian Child Poverty Under the Age of 5 Correlation Chart
The statistical analysis conducted on geographies consisting of 114,250,981 people shows no correlation between the proportion of Immigrants from Lithuania and poverty level among children under the age of 5 in the United States with a correlation coefficient (R) of -0.041 and weighted average of 14.1%. Similarly, the statistical analysis conducted on geographies consisting of 180,561,858 people shows a poor positive correlation between the proportion of Bolivians and poverty level among children under the age of 5 in the United States with a correlation coefficient (R) of 0.116 and weighted average of 13.8%, a difference of 2.0%.
Child Poverty Under the Age of 5 Correlation Summary
| Measurement | Immigrants from Lithuania | Bolivian |
| Minimum | 3.9% | 0.67% |
| Maximum | 24.3% | 58.4% |
| Range | 20.4% | 57.8% |
| Mean | 11.8% | 13.3% |
| Median | 11.7% | 11.4% |
| Interquartile 25% (IQ1) | 9.6% | 8.8% |
| Interquartile 75% (IQ3) | 14.1% | 16.4% |
| Interquartile Range (IQR) | 4.5% | 7.5% |
| Standard Deviation (Sample) | 4.9% | 9.0% |
| Standard Deviation (Population) | 4.8% | 8.9% |
Demographics Similar to Immigrants from Lithuania and Bolivians by Child Poverty Under the Age of 5
In terms of child poverty under the age of 5, the demographic groups most similar to Immigrants from Lithuania are Tongan (14.2%, a difference of 0.49%), Asian (14.0%, a difference of 0.93%), Cypriot (14.0%, a difference of 0.93%), Bulgarian (13.9%, a difference of 1.5%), and Immigrants from Indonesia (14.3%, a difference of 1.7%). Similarly, the demographic groups most similar to Bolivians are Immigrants from Bolivia (13.8%, a difference of 0.080%), Immigrants from Japan (13.8%, a difference of 0.30%), Bulgarian (13.9%, a difference of 0.52%), Immigrants from Ireland (13.7%, a difference of 0.70%), and Asian (14.0%, a difference of 1.0%).
| Demographics | Rating | Rank | Child Poverty Under the Age of 5 |
| Bhutanese | 100.0 /100 | #13 | Exceptional 13.4% |
| Okinawans | 100.0 /100 | #14 | Exceptional 13.4% |
| Indians (Asian) | 100.0 /100 | #15 | Exceptional 13.4% |
| Immigrants | Eastern Asia | 100.0 /100 | #16 | Exceptional 13.5% |
| Assyrians/Chaldeans/Syriacs | 100.0 /100 | #17 | Exceptional 13.6% |
| Immigrants | China | 100.0 /100 | #18 | Exceptional 13.6% |
| Immigrants | Ireland | 100.0 /100 | #19 | Exceptional 13.7% |
| Immigrants | Japan | 100.0 /100 | #20 | Exceptional 13.8% |
| Bolivians | 100.0 /100 | #21 | Exceptional 13.8% |
| Immigrants | Bolivia | 100.0 /100 | #22 | Exceptional 13.8% |
| Bulgarians | 99.9 /100 | #23 | Exceptional 13.9% |
| Asians | 99.9 /100 | #24 | Exceptional 14.0% |
| Cypriots | 99.9 /100 | #25 | Exceptional 14.0% |
| Immigrants | Lithuania | 99.9 /100 | #26 | Exceptional 14.1% |
| Tongans | 99.9 /100 | #27 | Exceptional 14.2% |
| Immigrants | Indonesia | 99.8 /100 | #28 | Exceptional 14.3% |
| Immigrants | Asia | 99.8 /100 | #29 | Exceptional 14.4% |
| Cambodians | 99.8 /100 | #30 | Exceptional 14.4% |
| Koreans | 99.8 /100 | #31 | Exceptional 14.4% |
| Immigrants | Sri Lanka | 99.8 /100 | #32 | Exceptional 14.4% |
| Taiwanese | 99.8 /100 | #33 | Exceptional 14.5% |