Jamaican vs Immigrants from Costa Rica Child Poverty Under the Age of 5
COMPARE
Jamaican
Immigrants from Costa Rica
Child Poverty Under the Age of 5
Child Poverty Under the Age of 5 Comparison
Jamaicans
Immigrants from Costa Rica
20.4%
CHILD POVERTY UNDER THE AGE OF 5
0.1/ 100
METRIC RATING
270th/ 347
METRIC RANK
17.4%
CHILD POVERTY UNDER THE AGE OF 5
39.0/ 100
METRIC RATING
184th/ 347
METRIC RANK
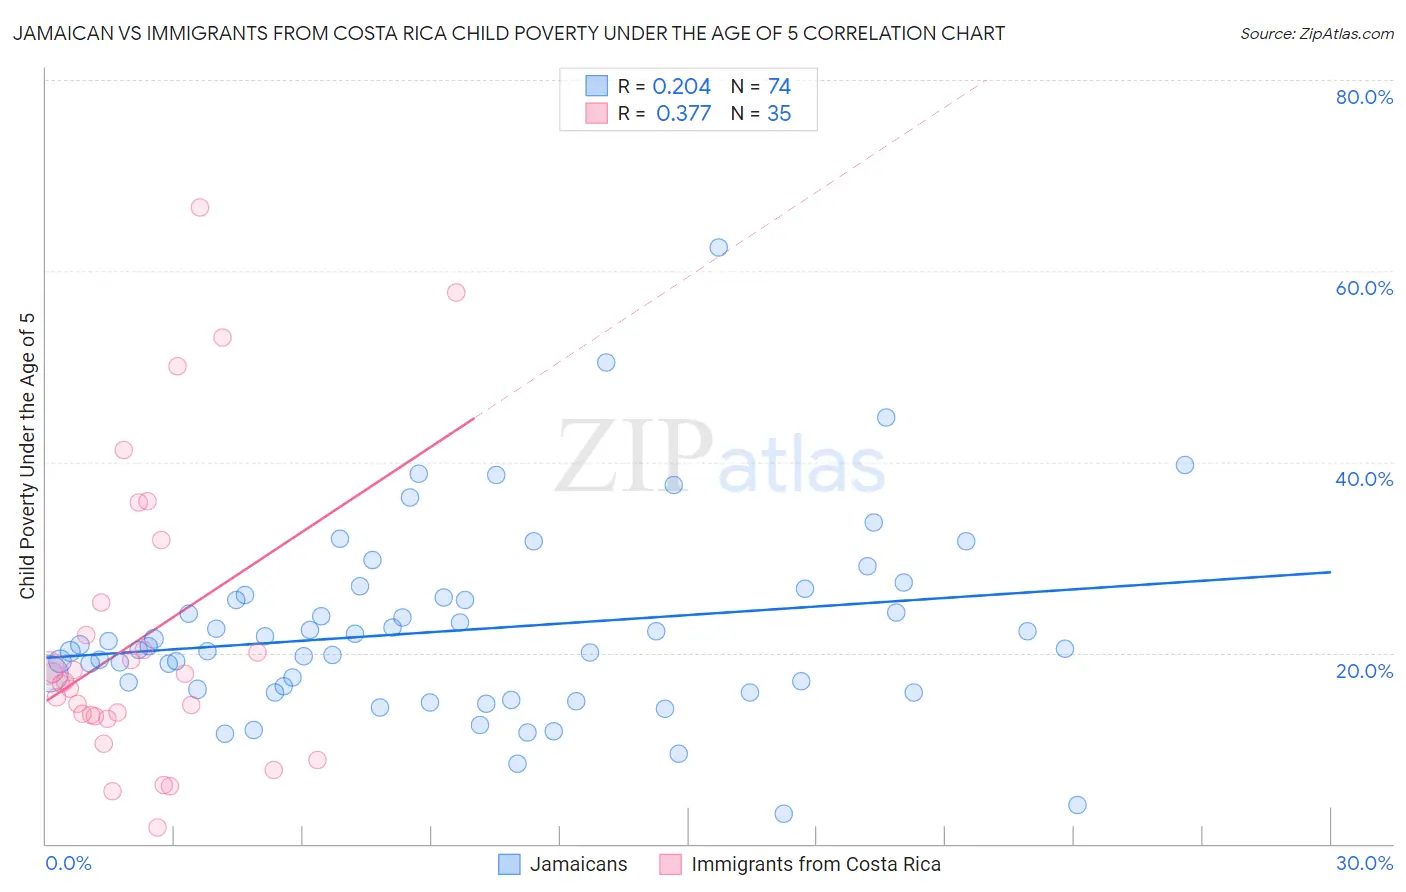
Jamaican vs Immigrants from Costa Rica Child Poverty Under the Age of 5 Correlation Chart
The statistical analysis conducted on geographies consisting of 355,780,377 people shows a weak positive correlation between the proportion of Jamaicans and poverty level among children under the age of 5 in the United States with a correlation coefficient (R) of 0.204 and weighted average of 20.4%. Similarly, the statistical analysis conducted on geographies consisting of 200,253,710 people shows a mild positive correlation between the proportion of Immigrants from Costa Rica and poverty level among children under the age of 5 in the United States with a correlation coefficient (R) of 0.377 and weighted average of 17.4%, a difference of 16.9%.
Child Poverty Under the Age of 5 Correlation Summary
| Measurement | Jamaican | Immigrants from Costa Rica |
| Minimum | 3.1% | 1.7% |
| Maximum | 62.5% | 66.7% |
| Range | 59.4% | 65.0% |
| Mean | 22.4% | 21.7% |
| Median | 20.6% | 17.1% |
| Interquartile 25% (IQ1) | 16.2% | 13.3% |
| Interquartile 75% (IQ3) | 25.8% | 25.2% |
| Interquartile Range (IQR) | 9.6% | 11.9% |
| Standard Deviation (Sample) | 9.9% | 15.6% |
| Standard Deviation (Population) | 9.8% | 15.4% |
Similar Demographics by Child Poverty Under the Age of 5
Demographics Similar to Jamaicans by Child Poverty Under the Age of 5
In terms of child poverty under the age of 5, the demographic groups most similar to Jamaicans are Immigrants from Burma/Myanmar (20.4%, a difference of 0.070%), Ottawa (20.3%, a difference of 0.16%), Belizean (20.3%, a difference of 0.16%), American (20.5%, a difference of 0.45%), and Aleut (20.3%, a difference of 0.56%).
| Demographics | Rating | Rank | Child Poverty Under the Age of 5 |
| Barbadians | 0.1 /100 | #263 | Tragic 20.2% |
| Immigrants | Liberia | 0.1 /100 | #264 | Tragic 20.2% |
| Spanish American Indians | 0.1 /100 | #265 | Tragic 20.2% |
| Aleuts | 0.1 /100 | #266 | Tragic 20.3% |
| Ottawa | 0.1 /100 | #267 | Tragic 20.3% |
| Belizeans | 0.1 /100 | #268 | Tragic 20.3% |
| Immigrants | Burma/Myanmar | 0.1 /100 | #269 | Tragic 20.4% |
| Jamaicans | 0.1 /100 | #270 | Tragic 20.4% |
| Americans | 0.1 /100 | #271 | Tragic 20.5% |
| Immigrants | Jamaica | 0.1 /100 | #272 | Tragic 20.5% |
| Central Americans | 0.1 /100 | #273 | Tragic 20.6% |
| Immigrants | Belize | 0.1 /100 | #274 | Tragic 20.6% |
| Bangladeshis | 0.1 /100 | #275 | Tragic 20.6% |
| West Indians | 0.0 /100 | #276 | Tragic 20.6% |
| Immigrants | West Indies | 0.0 /100 | #277 | Tragic 20.7% |
Demographics Similar to Immigrants from Costa Rica by Child Poverty Under the Age of 5
In terms of child poverty under the age of 5, the demographic groups most similar to Immigrants from Costa Rica are Immigrants from Armenia (17.5%, a difference of 0.11%), Lebanese (17.4%, a difference of 0.14%), Arab (17.4%, a difference of 0.18%), Immigrants from Germany (17.4%, a difference of 0.21%), and South American Indian (17.4%, a difference of 0.25%).
| Demographics | Rating | Rank | Child Poverty Under the Age of 5 |
| Immigrants | Sierra Leone | 43.6 /100 | #177 | Average 17.3% |
| Immigrants | Cameroon | 42.7 /100 | #178 | Average 17.4% |
| Hawaiians | 41.5 /100 | #179 | Average 17.4% |
| South American Indians | 41.4 /100 | #180 | Average 17.4% |
| Immigrants | Germany | 41.0 /100 | #181 | Average 17.4% |
| Arabs | 40.7 /100 | #182 | Average 17.4% |
| Lebanese | 40.3 /100 | #183 | Average 17.4% |
| Immigrants | Costa Rica | 39.0 /100 | #184 | Fair 17.4% |
| Immigrants | Armenia | 38.0 /100 | #185 | Fair 17.5% |
| Immigrants | Bosnia and Herzegovina | 35.0 /100 | #186 | Fair 17.5% |
| Kenyans | 34.7 /100 | #187 | Fair 17.5% |
| Carpatho Rusyns | 33.6 /100 | #188 | Fair 17.5% |
| French | 33.6 /100 | #189 | Fair 17.5% |
| Slovaks | 29.2 /100 | #190 | Fair 17.6% |
| Immigrants | Afghanistan | 27.9 /100 | #191 | Fair 17.7% |