Inupiat vs Immigrants from Sweden Female Poverty

COMPARE

Inupiat
Race
Ancestry
AfghanAfricanAlaska NativeAlaskan AthabascanAlbanianAleutAlsatianAmericanApacheArabArapahoArgentineanArmenianAssyrian/Chaldean/SyriacAustralianAustrianBahamianBangladeshiBarbadianBasqueBelgianBelizeanBermudanBhutaneseBlackfeetBolivianBrazilianBritishBritish West IndianBulgarianBurmeseCajunCambodianCanadianCape VerdeanCarpatho RusynCelticCentral AmericanCentral American IndianCherokeeCheyenneChickasawChileanChineseChippewaChoctawColombianColvilleComancheCosta RicanCreeCreekCroatianCrowCubanCypriotCzechCzechoslovakianDanishDelawareDominicanDutchDutch West IndianEastern EuropeanEcuadorianEgyptianEnglishEstonianEthiopianEuropeanFijianFilipinoFinnishFrenchFrench American IndianFrench CanadianGermanGerman RussianGhanaianGreekGuamanian/ChamorroGuatemalanGuyaneseHaitianHmongHonduranHopiHoumaHungarianIcelanderIndian (Asian)IndonesianInupiatIranianIraqiIrishIroquoisIsraeliItalianJamaicanJapaneseJordanianKenyanKiowaKoreanLaotianLatvianLebaneseLiberianLithuanianLumbeeLuxembourgerMacedonianMalaysianMalteseMarshalleseMenomineeMexicanMexican American IndianMongolianMoroccanNative HawaiianNavajoNepaleseNew ZealanderNicaraguanNigerianNorthern EuropeanNorwegianOkinawanOsageOttawaPaiutePakistaniPalestinianPanamanianParaguayanPennsylvania GermanPeruvianPimaPolishPortuguesePotawatomiPuebloPuerto RicanPuget Sound SalishRomanianRussianSalvadoranSamoanScandinavianScotch-IrishScottishSeminoleSenegaleseSerbianShoshoneSierra LeoneanSiouxSlavicSlovakSloveneSomaliSouth AfricanSouth AmericanSouth American IndianSoviet UnionSpaniardSpanishSpanish AmericanSpanish American IndianSri LankanSubsaharan AfricanSudaneseSwedishSwissSyrianTaiwaneseThaiTlingit-HaidaTohono O'OdhamTonganTrinidadian and TobagonianTsimshianTurkishU.S. Virgin IslanderUgandanUkrainianUruguayanUteVenezuelanVietnameseWelshWest IndianYakamaYaquiYugoslavianYumanYup'ikZimbabwean
Immigration
NonimmigrantsImmigrantsAfghanistanAfricaAlbaniaArgentinaArmeniaAsiaAustraliaAustriaBahamasBangladeshBarbadosBelarusBelgiumBelizeBoliviaBosnia and HerzegovinaBrazilBulgariaBurma/MyanmarCabo VerdeCambodiaCameroonCanadaCaribbeanCentral AmericaChileChinaColombiaCongoCosta RicaCroatiaCubaCzechoslovakiaDenmarkDominicaDominican RepublicEastern AfricaEastern AsiaEastern EuropeEcuadorEgyptEl SalvadorEnglandEritreaEthiopiaEuropeFijiFranceGermanyGhanaGreeceGrenadaGuatemalaGuyanaHaitiHondurasHong KongHungaryIndiaIndonesiaIranIraqIrelandIsraelItalyJamaicaJapanJordanKazakhstanKenyaKoreaKuwaitLaosLatin AmericaLatviaLebanonLiberiaLithuaniaMalaysiaMexicoMicronesiaMiddle AfricaMoldovaMoroccoNepalNetherlandsNicaraguaNigeriaNorth AmericaNorth MacedoniaNorthern AfricaNorthern EuropeNorwayOceaniaPakistanPanamaPeruPhilippinesPolandPortugalRomaniaRussiaSaudi ArabiaScotlandSenegalSerbiaSierra LeoneSingaporeSomaliaSouth AfricaSouth AmericaSouth Central AsiaSouth Eastern AsiaSouthern EuropeSpainSri LankaSt. Vincent and the GrenadinesSudanSwitzerlandSyriaTaiwanThailandTrinidad and TobagoTurkeyUgandaUkraineUruguayUzbekistanVenezuelaVietnamWest IndiesWestern AfricaWestern AsiaWestern EuropeYemenZaireZimbabweAzores
Immigrants from Sweden
Race
Ancestry
AfghanAfricanAlaska NativeAlaskan AthabascanAlbanianAleutAlsatianAmericanApacheArabArapahoArgentineanArmenianAssyrian/Chaldean/SyriacAustralianAustrianBahamianBangladeshiBarbadianBasqueBelgianBelizeanBermudanBhutaneseBlackfeetBolivianBrazilianBritishBritish West IndianBulgarianBurmeseCajunCambodianCanadianCape VerdeanCarpatho RusynCelticCentral AmericanCentral American IndianCherokeeCheyenneChickasawChileanChineseChippewaChoctawColombianColvilleComancheCosta RicanCreeCreekCroatianCrowCubanCypriotCzechCzechoslovakianDanishDelawareDominicanDutchDutch West IndianEastern EuropeanEcuadorianEgyptianEnglishEstonianEthiopianEuropeanFijianFilipinoFinnishFrenchFrench American IndianFrench CanadianGermanGerman RussianGhanaianGreekGuamanian/ChamorroGuatemalanGuyaneseHaitianHmongHonduranHopiHoumaHungarianIcelanderIndian (Asian)IndonesianIranianIraqiIrishIroquoisIsraeliItalianJamaicanJapaneseJordanianKenyanKiowaKoreanLaotianLatvianLebaneseLiberianLithuanianLumbeeLuxembourgerMacedonianMalaysianMalteseMarshalleseMenomineeMexicanMexican American IndianMongolianMoroccanNative HawaiianNavajoNepaleseNew ZealanderNicaraguanNigerianNorthern EuropeanNorwegianOkinawanOsageOttawaPaiutePakistaniPalestinianPanamanianParaguayanPennsylvania GermanPeruvianPimaPolishPortuguesePotawatomiPuebloPuerto RicanPuget Sound SalishRomanianRussianSalvadoranSamoanScandinavianScotch-IrishScottishSeminoleSenegaleseSerbianShoshoneSierra LeoneanSiouxSlavicSlovakSloveneSomaliSouth AfricanSouth AmericanSouth American IndianSoviet UnionSpaniardSpanishSpanish AmericanSpanish American IndianSri LankanSubsaharan AfricanSudaneseSwedishSwissSyrianTaiwaneseThaiTlingit-HaidaTohono O'OdhamTonganTrinidadian and TobagonianTsimshianTurkishU.S. Virgin IslanderUgandanUkrainianUruguayanUteVenezuelanVietnameseWelshWest IndianYakamaYaquiYugoslavianYumanYup'ikZimbabwean
Immigration
NonimmigrantsImmigrantsAfghanistanAfricaAlbaniaArgentinaArmeniaAsiaAustraliaAustriaBahamasBangladeshBarbadosBelarusBelgiumBelizeBoliviaBosnia and HerzegovinaBrazilBulgariaBurma/MyanmarCabo VerdeCambodiaCameroonCanadaCaribbeanCentral AmericaChileChinaColombiaCongoCosta RicaCroatiaCubaCzechoslovakiaDenmarkDominicaDominican RepublicEastern AfricaEastern AsiaEastern EuropeEcuadorEgyptEl SalvadorEnglandEritreaEthiopiaEuropeFijiFranceGermanyGhanaGreeceGrenadaGuatemalaGuyanaHaitiHondurasHong KongHungaryIndiaIndonesiaIranIraqIrelandIsraelItalyJamaicaJapanJordanKazakhstanKenyaKoreaKuwaitLaosLatin AmericaLatviaLebanonLiberiaLithuaniaMalaysiaMexicoMicronesiaMiddle AfricaMoldovaMoroccoNepalNetherlandsNicaraguaNigeriaNorth AmericaNorth MacedoniaNorthern AfricaNorthern EuropeNorwayOceaniaPakistanPanamaPeruPhilippinesPolandPortugalRomaniaRussiaSaudi ArabiaScotlandSenegalSerbiaSierra LeoneSingaporeSomaliaSouth AfricaSouth AmericaSouth Central AsiaSouth Eastern AsiaSouthern EuropeSpainSri LankaSt. Vincent and the GrenadinesSudanSwedenSwitzerlandSyriaTaiwanThailandTrinidad and TobagoTurkeyUgandaUkraineUruguayUzbekistanVenezuelaVietnamWest IndiesWestern AfricaWestern AsiaWestern EuropeYemenZaireZimbabweAzores
Female Poverty
Income
Poverty
Unemployment
Labor Participation
Family Structure
Vehicle Availability
Education Level
Disability

Female Poverty Comparison

Inupiat

Immigrants from Sweden

Tragic
Exceptional
16.2%
FEMALE POVERTY
0.0/ 100
METRIC RATING
286th/ 347
METRIC RANK
12.3%
FEMALE POVERTY
97.1/ 100
METRIC RATING
81st/ 347
METRIC RANK

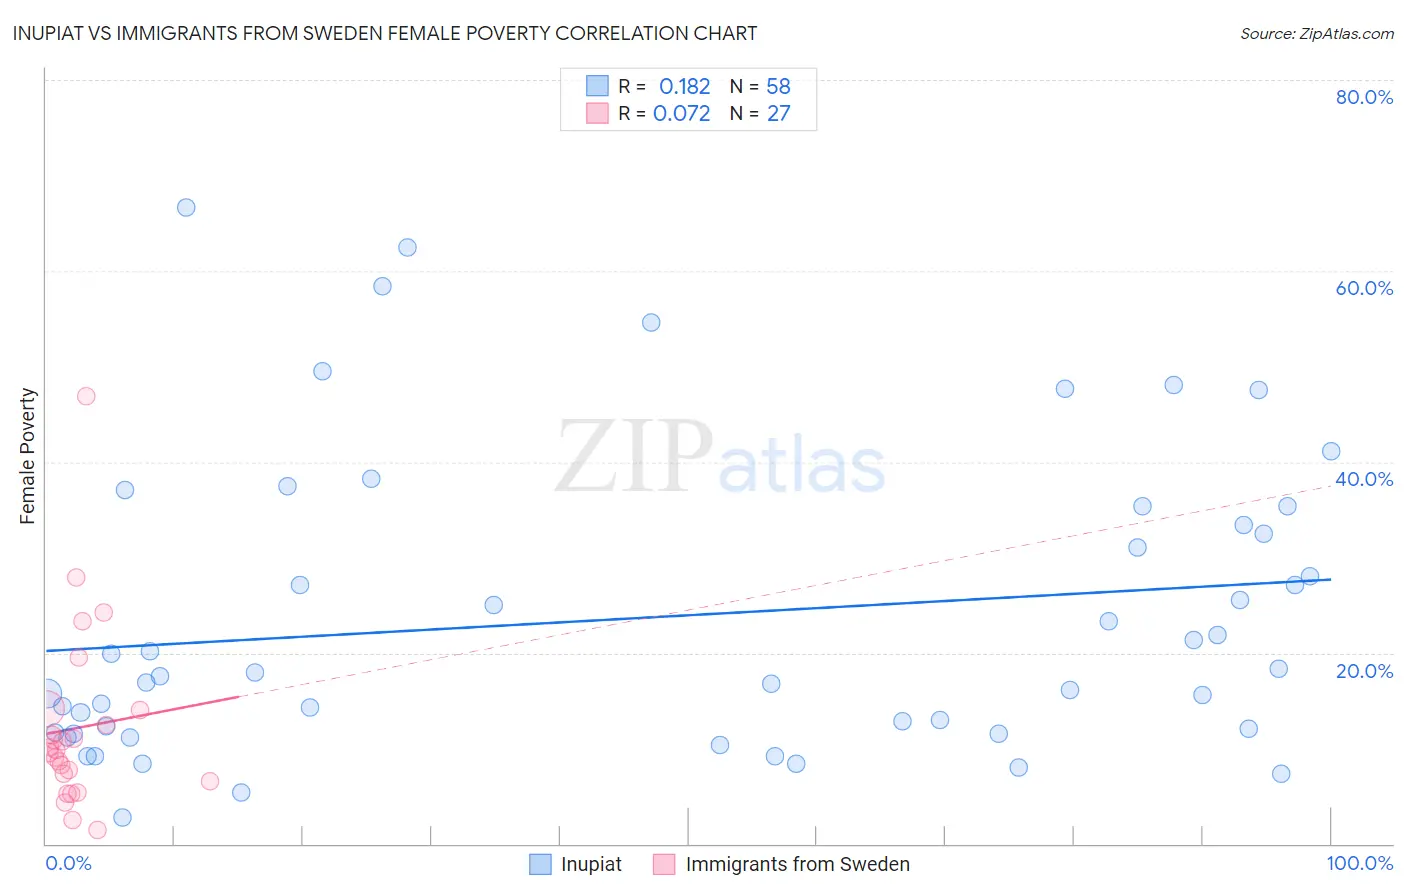
Inupiat vs Immigrants from Sweden Female Poverty Correlation Chart

The statistical analysis conducted on geographies consisting of 96,314,579 people shows a poor positive correlation between the proportion of Inupiat and poverty level among females in the United States with a correlation coefficient (R) of 0.182 and weighted average of 16.2%. Similarly, the statistical analysis conducted on geographies consisting of 164,683,428 people shows a slight positive correlation between the proportion of Immigrants from Sweden and poverty level among females in the United States with a correlation coefficient (R) of 0.072 and weighted average of 12.3%, a difference of 32.0%.
Inupiat vs Immigrants from Sweden Female Poverty

Female Poverty Correlation Summary

MeasurementInupiatImmigrants from Sweden
Minimum2.8%1.5%
Maximum66.7%46.8%
Range63.9%45.4%
Mean23.7%12.1%
Median17.7%9.8%
Interquartile 25% (IQ1)11.6%6.5%
Interquartile 75% (IQ3)33.3%14.0%
Interquartile Range (IQR)21.7%7.5%
Standard Deviation (Sample)15.6%9.5%
Standard Deviation (Population)15.5%9.3%

Similar Demographics by Female Poverty

Demographics Similar to Inupiat by Female Poverty

In terms of female poverty, the demographic groups most similar to Inupiat are Immigrants from Belize (16.3%, a difference of 0.19%), Comanche (16.2%, a difference of 0.44%), Spanish American (16.2%, a difference of 0.52%), Immigrants from Cuba (16.1%, a difference of 0.57%), and Immigrants from Haiti (16.1%, a difference of 0.65%).
DemographicsRating | RankFemale Poverty
Immigrants | Bahamas
0.0
/100
|
#279
Tragic
16.1%
Vietnamese
0.0
/100
|
#280
Tragic
16.1%
West Indians
0.0
/100
|
#281
Tragic
16.1%
Immigrants | Haiti
0.0
/100
|
#282
Tragic
16.1%
Immigrants | Cuba
0.0
/100
|
#283
Tragic
16.1%
Spanish Americans
0.0
/100
|
#284
Tragic
16.2%
Comanche
0.0
/100
|
#285
Tragic
16.2%
Inupiat
0.0
/100
|
#286
Tragic
16.2%
Immigrants | Belize
0.0
/100
|
#287
Tragic
16.3%
Indonesians
0.0
/100
|
#288
Tragic
16.4%
Blackfeet
0.0
/100
|
#289
Tragic
16.4%
Immigrants | Bangladesh
0.0
/100
|
#290
Tragic
16.4%
Yaqui
0.0
/100
|
#291
Tragic
16.4%
Immigrants | Zaire
0.0
/100
|
#292
Tragic
16.4%
Immigrants | Latin America
0.0
/100
|
#293
Tragic
16.4%

Demographics Similar to Immigrants from Sweden by Female Poverty

In terms of female poverty, the demographic groups most similar to Immigrants from Sweden are Slovak (12.3%, a difference of 0.0%), Jordanian (12.3%, a difference of 0.010%), Immigrants from North America (12.3%, a difference of 0.050%), Egyptian (12.3%, a difference of 0.12%), and Serbian (12.3%, a difference of 0.13%).
DemographicsRating | RankFemale Poverty
Immigrants | Canada
97.5
/100
|
#74
Exceptional
12.3%
Europeans
97.4
/100
|
#75
Exceptional
12.3%
Immigrants | Eastern Europe
97.2
/100
|
#76
Exceptional
12.3%
Serbians
97.2
/100
|
#77
Exceptional
12.3%
Egyptians
97.2
/100
|
#78
Exceptional
12.3%
Immigrants | North America
97.1
/100
|
#79
Exceptional
12.3%
Slovaks
97.1
/100
|
#80
Exceptional
12.3%
Immigrants | Sweden
97.1
/100
|
#81
Exceptional
12.3%
Jordanians
97.1
/100
|
#82
Exceptional
12.3%
Immigrants | England
96.9
/100
|
#83
Exceptional
12.3%
Northern Europeans
96.6
/100
|
#84
Exceptional
12.4%
Irish
96.5
/100
|
#85
Exceptional
12.4%
Dutch
96.5
/100
|
#86
Exceptional
12.4%
Okinawans
96.4
/100
|
#87
Exceptional
12.4%
Finns
96.4
/100
|
#88
Exceptional
12.4%