Inupiat vs Croatian Child Poverty Under the Age of 16
COMPARE
Inupiat
Croatian
Child Poverty Under the Age of 16
Child Poverty Under the Age of 16 Comparison
Inupiat
Croatians
19.2%
CHILD POVERTY UNDER THE AGE OF 16
0.2/ 100
METRIC RATING
256th/ 347
METRIC RANK
13.8%
CHILD POVERTY UNDER THE AGE OF 16
99.4/ 100
METRIC RATING
41st/ 347
METRIC RANK
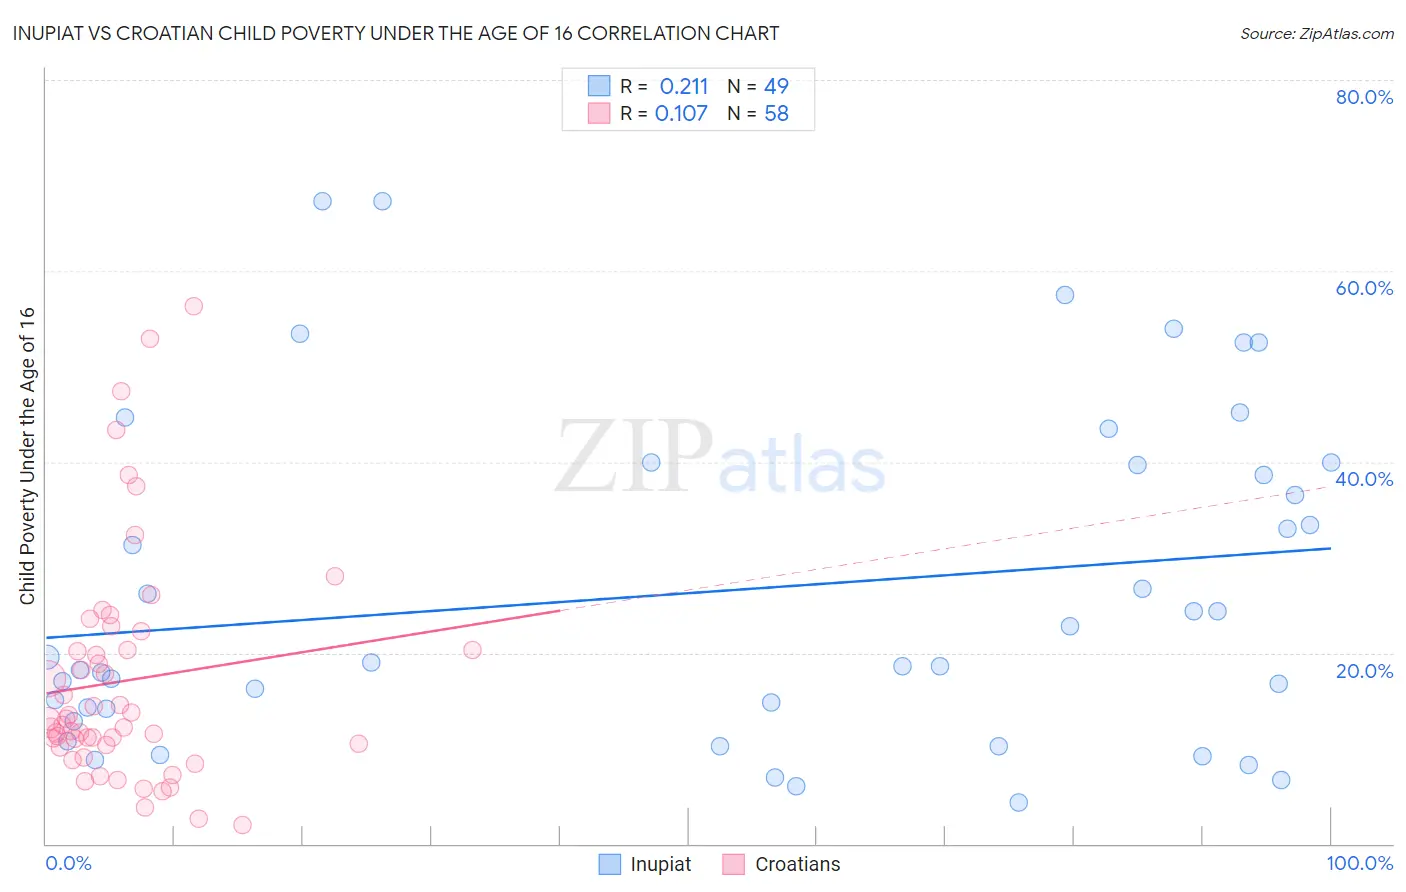
Inupiat vs Croatian Child Poverty Under the Age of 16 Correlation Chart
The statistical analysis conducted on geographies consisting of 96,193,869 people shows a weak positive correlation between the proportion of Inupiat and poverty level among children under the age of 16 in the United States with a correlation coefficient (R) of 0.211 and weighted average of 19.2%. Similarly, the statistical analysis conducted on geographies consisting of 371,525,585 people shows a poor positive correlation between the proportion of Croatians and poverty level among children under the age of 16 in the United States with a correlation coefficient (R) of 0.107 and weighted average of 13.8%, a difference of 39.6%.
Child Poverty Under the Age of 16 Correlation Summary
| Measurement | Inupiat | Croatian |
| Minimum | 4.3% | 2.0% |
| Maximum | 67.3% | 56.2% |
| Range | 63.0% | 54.3% |
| Mean | 26.4% | 17.1% |
| Median | 19.0% | 12.8% |
| Interquartile 25% (IQ1) | 13.5% | 10.3% |
| Interquartile 75% (IQ3) | 39.8% | 20.3% |
| Interquartile Range (IQR) | 26.4% | 10.0% |
| Standard Deviation (Sample) | 17.2% | 12.0% |
| Standard Deviation (Population) | 17.0% | 11.9% |
Similar Demographics by Child Poverty Under the Age of 16
Demographics Similar to Inupiat by Child Poverty Under the Age of 16
In terms of child poverty under the age of 16, the demographic groups most similar to Inupiat are Ottawa (19.2%, a difference of 0.020%), Trinidadian and Tobagonian (19.2%, a difference of 0.090%), Spanish American (19.2%, a difference of 0.090%), Immigrants from Western Africa (19.2%, a difference of 0.26%), and Salvadoran (19.1%, a difference of 0.50%).
| Demographics | Rating | Rank | Child Poverty Under the Age of 16 |
| Potawatomi | 0.3 /100 | #249 | Tragic 19.0% |
| Immigrants | Middle Africa | 0.3 /100 | #250 | Tragic 19.0% |
| Immigrants | Ghana | 0.3 /100 | #251 | Tragic 19.1% |
| Immigrants | Trinidad and Tobago | 0.3 /100 | #252 | Tragic 19.1% |
| Salvadorans | 0.3 /100 | #253 | Tragic 19.1% |
| Immigrants | Western Africa | 0.2 /100 | #254 | Tragic 19.2% |
| Trinidadians and Tobagonians | 0.2 /100 | #255 | Tragic 19.2% |
| Inupiat | 0.2 /100 | #256 | Tragic 19.2% |
| Ottawa | 0.2 /100 | #257 | Tragic 19.2% |
| Spanish Americans | 0.2 /100 | #258 | Tragic 19.2% |
| Mexican American Indians | 0.2 /100 | #259 | Tragic 19.3% |
| Guyanese | 0.2 /100 | #260 | Tragic 19.3% |
| Immigrants | Burma/Myanmar | 0.1 /100 | #261 | Tragic 19.4% |
| Immigrants | Guyana | 0.1 /100 | #262 | Tragic 19.4% |
| Vietnamese | 0.1 /100 | #263 | Tragic 19.4% |
Demographics Similar to Croatians by Child Poverty Under the Age of 16
In terms of child poverty under the age of 16, the demographic groups most similar to Croatians are Immigrants from Sri Lanka (13.8%, a difference of 0.080%), Immigrants from Moldova (13.8%, a difference of 0.14%), Immigrants from Scotland (13.7%, a difference of 0.16%), Greek (13.8%, a difference of 0.31%), and Czech (13.8%, a difference of 0.37%).
| Demographics | Rating | Rank | Child Poverty Under the Age of 16 |
| Russians | 99.6 /100 | #34 | Exceptional 13.5% |
| Lithuanians | 99.6 /100 | #35 | Exceptional 13.5% |
| Immigrants | Northern Europe | 99.6 /100 | #36 | Exceptional 13.6% |
| Immigrants | Bolivia | 99.6 /100 | #37 | Exceptional 13.6% |
| Luxembourgers | 99.5 /100 | #38 | Exceptional 13.6% |
| Immigrants | Australia | 99.5 /100 | #39 | Exceptional 13.6% |
| Immigrants | Scotland | 99.4 /100 | #40 | Exceptional 13.7% |
| Croatians | 99.4 /100 | #41 | Exceptional 13.8% |
| Immigrants | Sri Lanka | 99.3 /100 | #42 | Exceptional 13.8% |
| Immigrants | Moldova | 99.3 /100 | #43 | Exceptional 13.8% |
| Greeks | 99.3 /100 | #44 | Exceptional 13.8% |
| Czechs | 99.3 /100 | #45 | Exceptional 13.8% |
| Immigrants | Asia | 99.2 /100 | #46 | Exceptional 13.8% |
| Estonians | 99.2 /100 | #47 | Exceptional 13.9% |
| Koreans | 99.2 /100 | #48 | Exceptional 13.9% |