Inupiat vs Cree Child Poverty Under the Age of 16

COMPARE

Inupiat
Race
Ancestry
AfghanAfricanAlaska NativeAlaskan AthabascanAlbanianAleutAlsatianAmericanApacheArabArapahoArgentineanArmenianAssyrian/Chaldean/SyriacAustralianAustrianBahamianBangladeshiBarbadianBasqueBelgianBelizeanBermudanBhutaneseBlackfeetBolivianBrazilianBritishBritish West IndianBulgarianBurmeseCajunCambodianCanadianCape VerdeanCarpatho RusynCelticCentral AmericanCentral American IndianCherokeeCheyenneChickasawChileanChineseChippewaChoctawColombianColvilleComancheCosta RicanCreekCroatianCrowCubanCypriotCzechCzechoslovakianDanishDelawareDominicanDutchDutch West IndianEastern EuropeanEcuadorianEgyptianEnglishEstonianEthiopianEuropeanFijianFilipinoFinnishFrenchFrench American IndianFrench CanadianGermanGerman RussianGhanaianGreekGuamanian/ChamorroGuatemalanGuyaneseHaitianHmongHonduranHopiHoumaHungarianIcelanderIndian (Asian)IndonesianInupiatIranianIraqiIrishIroquoisIsraeliItalianJamaicanJapaneseJordanianKenyanKiowaKoreanLaotianLatvianLebaneseLiberianLithuanianLumbeeLuxembourgerMacedonianMalaysianMalteseMarshalleseMenomineeMexicanMexican American IndianMongolianMoroccanNative HawaiianNavajoNepaleseNew ZealanderNicaraguanNigerianNorthern EuropeanNorwegianOkinawanOsageOttawaPaiutePakistaniPalestinianPanamanianParaguayanPennsylvania GermanPeruvianPimaPolishPortuguesePotawatomiPuebloPuerto RicanPuget Sound SalishRomanianRussianSalvadoranSamoanScandinavianScotch-IrishScottishSeminoleSenegaleseSerbianShoshoneSierra LeoneanSiouxSlavicSlovakSloveneSomaliSouth AfricanSouth AmericanSouth American IndianSoviet UnionSpaniardSpanishSpanish AmericanSpanish American IndianSri LankanSubsaharan AfricanSudaneseSwedishSwissSyrianTaiwaneseThaiTlingit-HaidaTohono O'OdhamTonganTrinidadian and TobagonianTsimshianTurkishU.S. Virgin IslanderUgandanUkrainianUruguayanUteVenezuelanVietnameseWelshWest IndianYakamaYaquiYugoslavianYumanYup'ikZimbabwean
Immigration
NonimmigrantsImmigrantsAfghanistanAfricaAlbaniaArgentinaArmeniaAsiaAustraliaAustriaBahamasBangladeshBarbadosBelarusBelgiumBelizeBoliviaBosnia and HerzegovinaBrazilBulgariaBurma/MyanmarCabo VerdeCambodiaCameroonCanadaCaribbeanCentral AmericaChileChinaColombiaCongoCosta RicaCroatiaCubaCzechoslovakiaDenmarkDominicaDominican RepublicEastern AfricaEastern AsiaEastern EuropeEcuadorEgyptEl SalvadorEnglandEritreaEthiopiaEuropeFijiFranceGermanyGhanaGreeceGrenadaGuatemalaGuyanaHaitiHondurasHong KongHungaryIndiaIndonesiaIranIraqIrelandIsraelItalyJamaicaJapanJordanKazakhstanKenyaKoreaKuwaitLaosLatin AmericaLatviaLebanonLiberiaLithuaniaMalaysiaMexicoMicronesiaMiddle AfricaMoldovaMoroccoNepalNetherlandsNicaraguaNigeriaNorth AmericaNorth MacedoniaNorthern AfricaNorthern EuropeNorwayOceaniaPakistanPanamaPeruPhilippinesPolandPortugalRomaniaRussiaSaudi ArabiaScotlandSenegalSerbiaSierra LeoneSingaporeSomaliaSouth AfricaSouth AmericaSouth Central AsiaSouth Eastern AsiaSouthern EuropeSpainSri LankaSt. Vincent and the GrenadinesSudanSwedenSwitzerlandSyriaTaiwanThailandTrinidad and TobagoTurkeyUgandaUkraineUruguayUzbekistanVenezuelaVietnamWest IndiesWestern AfricaWestern AsiaWestern EuropeYemenZaireZimbabweAzores
Cree
Race
Ancestry
AfghanAfricanAlaska NativeAlaskan AthabascanAlbanianAleutAlsatianAmericanApacheArabArapahoArgentineanArmenianAssyrian/Chaldean/SyriacAustralianAustrianBahamianBangladeshiBarbadianBasqueBelgianBelizeanBermudanBhutaneseBlackfeetBolivianBrazilianBritishBritish West IndianBulgarianBurmeseCajunCambodianCanadianCape VerdeanCarpatho RusynCelticCentral AmericanCentral American IndianCherokeeCheyenneChickasawChileanChineseChippewaChoctawColombianColvilleComancheCosta RicanCreeCreekCroatianCrowCubanCypriotCzechCzechoslovakianDanishDelawareDominicanDutchDutch West IndianEastern EuropeanEcuadorianEgyptianEnglishEstonianEthiopianEuropeanFijianFilipinoFinnishFrenchFrench American IndianFrench CanadianGermanGerman RussianGhanaianGreekGuamanian/ChamorroGuatemalanGuyaneseHaitianHmongHonduranHopiHoumaHungarianIcelanderIndian (Asian)IndonesianIranianIraqiIrishIroquoisIsraeliItalianJamaicanJapaneseJordanianKenyanKiowaKoreanLaotianLatvianLebaneseLiberianLithuanianLumbeeLuxembourgerMacedonianMalaysianMalteseMarshalleseMenomineeMexicanMexican American IndianMongolianMoroccanNative HawaiianNavajoNepaleseNew ZealanderNicaraguanNigerianNorthern EuropeanNorwegianOkinawanOsageOttawaPaiutePakistaniPalestinianPanamanianParaguayanPennsylvania GermanPeruvianPimaPolishPortuguesePotawatomiPuebloPuerto RicanPuget Sound SalishRomanianRussianSalvadoranSamoanScandinavianScotch-IrishScottishSeminoleSenegaleseSerbianShoshoneSierra LeoneanSiouxSlavicSlovakSloveneSomaliSouth AfricanSouth AmericanSouth American IndianSoviet UnionSpaniardSpanishSpanish AmericanSpanish American IndianSri LankanSubsaharan AfricanSudaneseSwedishSwissSyrianTaiwaneseThaiTlingit-HaidaTohono O'OdhamTonganTrinidadian and TobagonianTsimshianTurkishU.S. Virgin IslanderUgandanUkrainianUruguayanUteVenezuelanVietnameseWelshWest IndianYakamaYaquiYugoslavianYumanYup'ikZimbabwean
Immigration
NonimmigrantsImmigrantsAfghanistanAfricaAlbaniaArgentinaArmeniaAsiaAustraliaAustriaBahamasBangladeshBarbadosBelarusBelgiumBelizeBoliviaBosnia and HerzegovinaBrazilBulgariaBurma/MyanmarCabo VerdeCambodiaCameroonCanadaCaribbeanCentral AmericaChileChinaColombiaCongoCosta RicaCroatiaCubaCzechoslovakiaDenmarkDominicaDominican RepublicEastern AfricaEastern AsiaEastern EuropeEcuadorEgyptEl SalvadorEnglandEritreaEthiopiaEuropeFijiFranceGermanyGhanaGreeceGrenadaGuatemalaGuyanaHaitiHondurasHong KongHungaryIndiaIndonesiaIranIraqIrelandIsraelItalyJamaicaJapanJordanKazakhstanKenyaKoreaKuwaitLaosLatin AmericaLatviaLebanonLiberiaLithuaniaMalaysiaMexicoMicronesiaMiddle AfricaMoldovaMoroccoNepalNetherlandsNicaraguaNigeriaNorth AmericaNorth MacedoniaNorthern AfricaNorthern EuropeNorwayOceaniaPakistanPanamaPeruPhilippinesPolandPortugalRomaniaRussiaSaudi ArabiaScotlandSenegalSerbiaSierra LeoneSingaporeSomaliaSouth AfricaSouth AmericaSouth Central AsiaSouth Eastern AsiaSouthern EuropeSpainSri LankaSt. Vincent and the GrenadinesSudanSwedenSwitzerlandSyriaTaiwanThailandTrinidad and TobagoTurkeyUgandaUkraineUruguayUzbekistanVenezuelaVietnamWest IndiesWestern AfricaWestern AsiaWestern EuropeYemenZaireZimbabweAzores
Child Poverty Under the Age of 16
Income
Poverty
Unemployment
Labor Participation
Family Structure
Vehicle Availability
Education Level
Disability

Child Poverty Under the Age of 16 Comparison

Inupiat

Cree

Tragic
Tragic
19.2%
CHILD POVERTY UNDER THE AGE OF 16
0.2/ 100
METRIC RATING
256th/ 347
METRIC RANK
18.5%
CHILD POVERTY UNDER THE AGE OF 16
0.9/ 100
METRIC RATING
236th/ 347
METRIC RANK

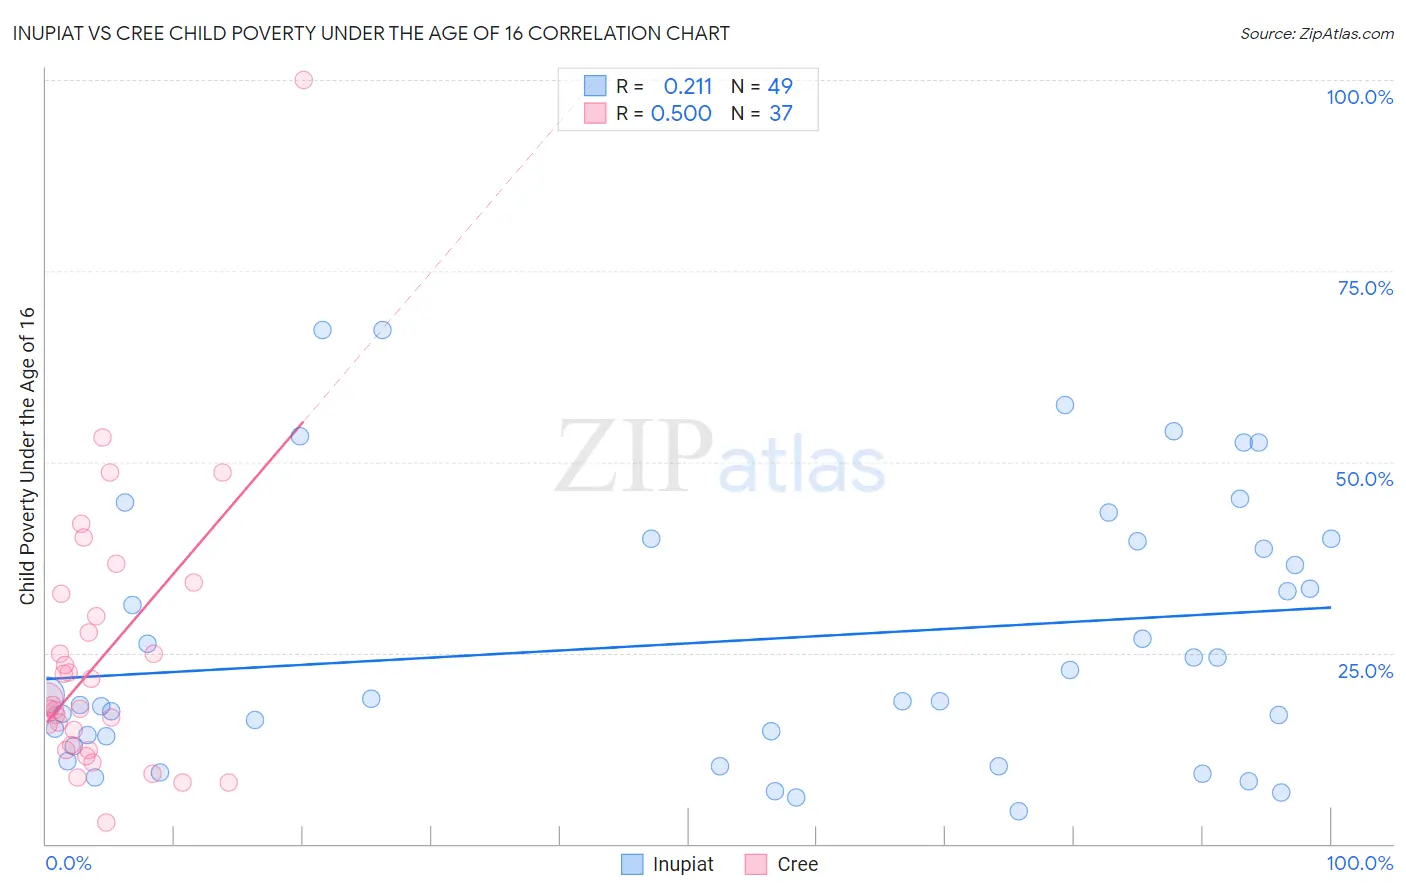
Inupiat vs Cree Child Poverty Under the Age of 16 Correlation Chart

The statistical analysis conducted on geographies consisting of 96,193,869 people shows a weak positive correlation between the proportion of Inupiat and poverty level among children under the age of 16 in the United States with a correlation coefficient (R) of 0.211 and weighted average of 19.2%. Similarly, the statistical analysis conducted on geographies consisting of 76,058,646 people shows a substantial positive correlation between the proportion of Cree and poverty level among children under the age of 16 in the United States with a correlation coefficient (R) of 0.500 and weighted average of 18.5%, a difference of 3.9%.
Inupiat vs Cree Child Poverty Under the Age of 16

Child Poverty Under the Age of 16 Correlation Summary

MeasurementInupiatCree
Minimum4.3%2.9%
Maximum67.3%100.0%
Range63.0%97.1%
Mean26.4%24.3%
Median19.0%18.2%
Interquartile 25% (IQ1)13.5%12.6%
Interquartile 75% (IQ3)39.8%31.3%
Interquartile Range (IQR)26.4%18.7%
Standard Deviation (Sample)17.2%17.9%
Standard Deviation (Population)17.0%17.6%

Demographics Similar to Inupiat and Cree by Child Poverty Under the Age of 16

In terms of child poverty under the age of 16, the demographic groups most similar to Inupiat are Trinidadian and Tobagonian (19.2%, a difference of 0.090%), Immigrants from Western Africa (19.2%, a difference of 0.26%), Salvadoran (19.1%, a difference of 0.50%), Immigrants from Trinidad and Tobago (19.1%, a difference of 0.70%), and Immigrants from Ghana (19.1%, a difference of 0.77%). Similarly, the demographic groups most similar to Cree are Sudanese (18.5%, a difference of 0.030%), Immigrants from Eritrea (18.5%, a difference of 0.27%), Immigrants from Sudan (18.5%, a difference of 0.31%), Ghanaian (18.6%, a difference of 0.36%), and Alsatian (18.6%, a difference of 0.82%).
DemographicsRating | RankChild Poverty Under the Age of 16
Cree
0.9
/100
|
#236
Tragic
18.5%
Sudanese
0.9
/100
|
#237
Tragic
18.5%
Immigrants | Eritrea
0.8
/100
|
#238
Tragic
18.5%
Immigrants | Sudan
0.8
/100
|
#239
Tragic
18.5%
Ghanaians
0.8
/100
|
#240
Tragic
18.6%
Alsatians
0.7
/100
|
#241
Tragic
18.6%
Immigrants | Laos
0.6
/100
|
#242
Tragic
18.7%
Immigrants | Cuba
0.6
/100
|
#243
Tragic
18.7%
Cape Verdeans
0.6
/100
|
#244
Tragic
18.7%
Shoshone
0.5
/100
|
#245
Tragic
18.8%
Immigrants | Nicaragua
0.4
/100
|
#246
Tragic
18.8%
French American Indians
0.4
/100
|
#247
Tragic
18.9%
Ecuadorians
0.3
/100
|
#248
Tragic
19.0%
Potawatomi
0.3
/100
|
#249
Tragic
19.0%
Immigrants | Middle Africa
0.3
/100
|
#250
Tragic
19.0%
Immigrants | Ghana
0.3
/100
|
#251
Tragic
19.1%
Immigrants | Trinidad and Tobago
0.3
/100
|
#252
Tragic
19.1%
Salvadorans
0.3
/100
|
#253
Tragic
19.1%
Immigrants | Western Africa
0.2
/100
|
#254
Tragic
19.2%
Trinidadians and Tobagonians
0.2
/100
|
#255
Tragic
19.2%
Inupiat
0.2
/100
|
#256
Tragic
19.2%