Immigrants from Uganda vs Ethiopian Poverty

COMPARE

Immigrants from Uganda
Race
Ancestry
AfghanAfricanAlaska NativeAlaskan AthabascanAlbanianAleutAlsatianAmericanApacheArabArapahoArgentineanArmenianAssyrian/Chaldean/SyriacAustralianAustrianBahamianBangladeshiBarbadianBasqueBelgianBelizeanBermudanBhutaneseBlackfeetBolivianBrazilianBritishBritish West IndianBulgarianBurmeseCajunCambodianCanadianCape VerdeanCarpatho RusynCelticCentral AmericanCentral American IndianCherokeeCheyenneChickasawChileanChineseChippewaChoctawColombianColvilleComancheCosta RicanCreeCreekCroatianCrowCubanCypriotCzechCzechoslovakianDanishDelawareDominicanDutchDutch West IndianEastern EuropeanEcuadorianEgyptianEnglishEstonianEuropeanFijianFilipinoFinnishFrenchFrench American IndianFrench CanadianGermanGerman RussianGhanaianGreekGuamanian/ChamorroGuatemalanGuyaneseHaitianHmongHonduranHopiHoumaHungarianIcelanderIndian (Asian)IndonesianInupiatIranianIraqiIrishIroquoisIsraeliItalianJamaicanJapaneseJordanianKenyanKiowaKoreanLaotianLatvianLebaneseLiberianLithuanianLumbeeLuxembourgerMacedonianMalaysianMalteseMarshalleseMenomineeMexicanMexican American IndianMongolianMoroccanNative HawaiianNavajoNepaleseNew ZealanderNicaraguanNigerianNorthern EuropeanNorwegianOkinawanOsageOttawaPaiutePakistaniPalestinianPanamanianParaguayanPennsylvania GermanPeruvianPimaPolishPortuguesePotawatomiPuebloPuerto RicanPuget Sound SalishRomanianRussianSalvadoranSamoanScandinavianScotch-IrishScottishSeminoleSenegaleseSerbianShoshoneSierra LeoneanSiouxSlavicSlovakSloveneSomaliSouth AfricanSouth AmericanSouth American IndianSoviet UnionSpaniardSpanishSpanish AmericanSpanish American IndianSri LankanSubsaharan AfricanSudaneseSwedishSwissSyrianTaiwaneseThaiTlingit-HaidaTohono O'OdhamTonganTrinidadian and TobagonianTsimshianTurkishU.S. Virgin IslanderUgandanUkrainianUruguayanUteVenezuelanVietnameseWelshWest IndianYakamaYaquiYugoslavianYumanYup'ikZimbabwean
Immigration
NonimmigrantsImmigrantsAfghanistanAfricaAlbaniaArgentinaArmeniaAsiaAustraliaAustriaBahamasBangladeshBarbadosBelarusBelgiumBelizeBoliviaBosnia and HerzegovinaBrazilBulgariaBurma/MyanmarCabo VerdeCambodiaCameroonCanadaCaribbeanCentral AmericaChileChinaColombiaCongoCosta RicaCroatiaCubaCzechoslovakiaDenmarkDominicaDominican RepublicEastern AfricaEastern AsiaEastern EuropeEcuadorEgyptEl SalvadorEnglandEritreaEthiopiaEuropeFijiFranceGermanyGhanaGreeceGrenadaGuatemalaGuyanaHaitiHondurasHong KongHungaryIndiaIndonesiaIranIraqIrelandIsraelItalyJamaicaJapanJordanKazakhstanKenyaKoreaKuwaitLaosLatin AmericaLatviaLebanonLiberiaLithuaniaMalaysiaMexicoMicronesiaMiddle AfricaMoldovaMoroccoNepalNetherlandsNicaraguaNigeriaNorth AmericaNorth MacedoniaNorthern AfricaNorthern EuropeNorwayOceaniaPakistanPanamaPeruPhilippinesPolandPortugalRomaniaRussiaSaudi ArabiaScotlandSenegalSerbiaSierra LeoneSingaporeSomaliaSouth AfricaSouth AmericaSouth Central AsiaSouth Eastern AsiaSouthern EuropeSpainSri LankaSt. Vincent and the GrenadinesSudanSwedenSwitzerlandSyriaTaiwanThailandTrinidad and TobagoTurkeyUgandaUkraineUruguayUzbekistanVenezuelaVietnamWest IndiesWestern AfricaWestern AsiaWestern EuropeYemenZaireZimbabweAzores
Ethiopian
Race
Ancestry
AfghanAfricanAlaska NativeAlaskan AthabascanAlbanianAleutAlsatianAmericanApacheArabArapahoArgentineanArmenianAssyrian/Chaldean/SyriacAustralianAustrianBahamianBangladeshiBarbadianBasqueBelgianBelizeanBermudanBhutaneseBlackfeetBolivianBrazilianBritishBritish West IndianBulgarianBurmeseCajunCambodianCanadianCape VerdeanCarpatho RusynCelticCentral AmericanCentral American IndianCherokeeCheyenneChickasawChileanChineseChippewaChoctawColombianColvilleComancheCosta RicanCreeCreekCroatianCrowCubanCypriotCzechCzechoslovakianDanishDelawareDominicanDutchDutch West IndianEastern EuropeanEcuadorianEgyptianEnglishEstonianEthiopianEuropeanFijianFilipinoFinnishFrenchFrench American IndianFrench CanadianGermanGerman RussianGhanaianGreekGuamanian/ChamorroGuatemalanGuyaneseHaitianHmongHonduranHopiHoumaHungarianIcelanderIndian (Asian)IndonesianInupiatIranianIraqiIrishIroquoisIsraeliItalianJamaicanJapaneseJordanianKenyanKiowaKoreanLaotianLatvianLebaneseLiberianLithuanianLumbeeLuxembourgerMacedonianMalaysianMalteseMarshalleseMenomineeMexicanMexican American IndianMongolianMoroccanNative HawaiianNavajoNepaleseNew ZealanderNicaraguanNigerianNorthern EuropeanNorwegianOkinawanOsageOttawaPaiutePakistaniPalestinianPanamanianParaguayanPennsylvania GermanPeruvianPimaPolishPortuguesePotawatomiPuebloPuerto RicanPuget Sound SalishRomanianRussianSalvadoranSamoanScandinavianScotch-IrishScottishSeminoleSenegaleseSerbianShoshoneSierra LeoneanSiouxSlavicSlovakSloveneSomaliSouth AfricanSouth AmericanSouth American IndianSoviet UnionSpaniardSpanishSpanish AmericanSpanish American IndianSri LankanSubsaharan AfricanSudaneseSwedishSwissSyrianTaiwaneseThaiTlingit-HaidaTohono O'OdhamTonganTrinidadian and TobagonianTsimshianTurkishU.S. Virgin IslanderUgandanUkrainianUruguayanUteVenezuelanVietnameseWelshWest IndianYakamaYaquiYugoslavianYumanYup'ikZimbabwean
Immigration
NonimmigrantsImmigrantsAfghanistanAfricaAlbaniaArgentinaArmeniaAsiaAustraliaAustriaBahamasBangladeshBarbadosBelarusBelgiumBelizeBoliviaBosnia and HerzegovinaBrazilBulgariaBurma/MyanmarCabo VerdeCambodiaCameroonCanadaCaribbeanCentral AmericaChileChinaColombiaCongoCosta RicaCroatiaCubaCzechoslovakiaDenmarkDominicaDominican RepublicEastern AfricaEastern AsiaEastern EuropeEcuadorEgyptEl SalvadorEnglandEritreaEthiopiaEuropeFijiFranceGermanyGhanaGreeceGrenadaGuatemalaGuyanaHaitiHondurasHong KongHungaryIndiaIndonesiaIranIraqIrelandIsraelItalyJamaicaJapanJordanKazakhstanKenyaKoreaKuwaitLaosLatin AmericaLatviaLebanonLiberiaLithuaniaMalaysiaMexicoMicronesiaMiddle AfricaMoldovaMoroccoNepalNetherlandsNicaraguaNigeriaNorth AmericaNorth MacedoniaNorthern AfricaNorthern EuropeNorwayOceaniaPakistanPanamaPeruPhilippinesPolandPortugalRomaniaRussiaSaudi ArabiaScotlandSenegalSerbiaSierra LeoneSingaporeSomaliaSouth AfricaSouth AmericaSouth Central AsiaSouth Eastern AsiaSouthern EuropeSpainSri LankaSt. Vincent and the GrenadinesSudanSwedenSwitzerlandSyriaTaiwanThailandTrinidad and TobagoTurkeyUkraineUruguayUzbekistanVenezuelaVietnamWest IndiesWestern AfricaWestern AsiaWestern EuropeYemenZaireZimbabweAzores
Poverty
Income
Poverty
Unemployment
Labor Participation
Family Structure
Vehicle Availability
Education Level
Disability

Poverty Comparison

Immigrants from Uganda

Ethiopians

Poor
Average
12.8%
POVERTY
16.5/ 100
METRIC RATING
201st/ 347
METRIC RANK
12.2%
POVERTY
59.1/ 100
METRIC RATING
162nd/ 347
METRIC RANK

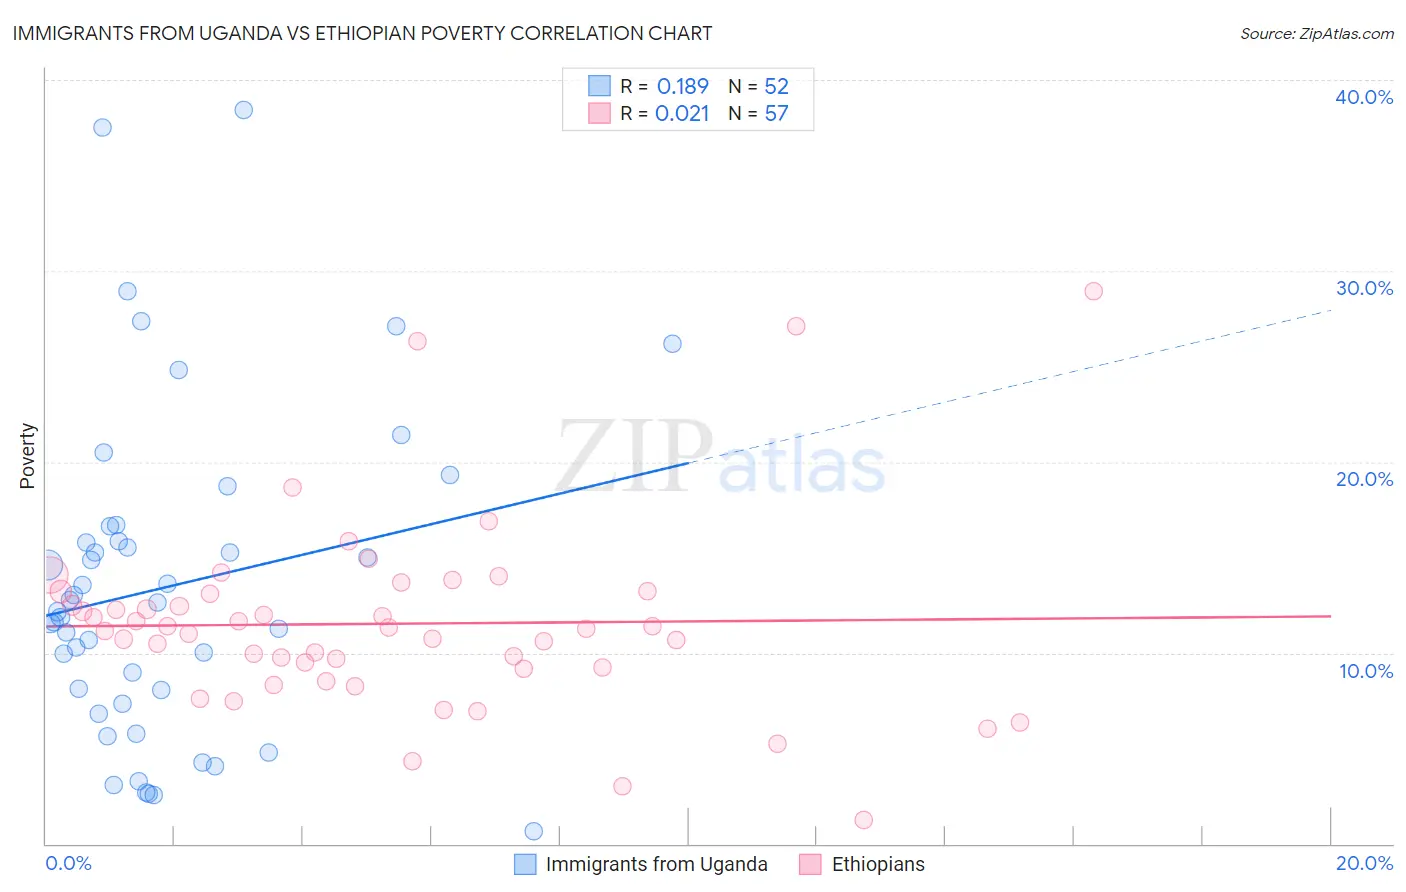
Immigrants from Uganda vs Ethiopian Poverty Correlation Chart

The statistical analysis conducted on geographies consisting of 125,970,249 people shows a poor positive correlation between the proportion of Immigrants from Uganda and poverty level in the United States with a correlation coefficient (R) of 0.189 and weighted average of 12.8%. Similarly, the statistical analysis conducted on geographies consisting of 223,124,419 people shows no correlation between the proportion of Ethiopians and poverty level in the United States with a correlation coefficient (R) of 0.021 and weighted average of 12.2%, a difference of 4.9%.
Immigrants from Uganda vs Ethiopian Poverty

Poverty Correlation Summary

MeasurementImmigrants from UgandaEthiopian
Minimum0.63%1.3%
Maximum38.4%28.9%
Range37.8%27.7%
Mean13.5%11.5%
Median12.4%11.3%
Interquartile 25% (IQ1)7.7%9.2%
Interquartile 75% (IQ3)16.2%13.1%
Interquartile Range (IQR)8.6%3.9%
Standard Deviation (Sample)8.5%5.0%
Standard Deviation (Population)8.4%4.9%

Similar Demographics by Poverty

Demographics Similar to Immigrants from Uganda by Poverty

In terms of poverty, the demographic groups most similar to Immigrants from Uganda are Spaniard (12.8%, a difference of 0.0%), Immigrants from Kenya (12.8%, a difference of 0.16%), Immigrants from Uruguay (12.8%, a difference of 0.16%), Hmong (12.8%, a difference of 0.26%), and Immigrants from Lebanon (12.8%, a difference of 0.35%).
DemographicsRating | RankPoverty
Arabs
21.1
/100
|
#194
Fair
12.7%
Immigrants | Kuwait
20.9
/100
|
#195
Fair
12.7%
Iraqis
20.8
/100
|
#196
Fair
12.7%
Immigrants | Lebanon
18.7
/100
|
#197
Poor
12.8%
Spanish
18.7
/100
|
#198
Poor
12.8%
Immigrants | Kenya
17.5
/100
|
#199
Poor
12.8%
Spaniards
16.5
/100
|
#200
Poor
12.8%
Immigrants | Uganda
16.5
/100
|
#201
Poor
12.8%
Immigrants | Uruguay
15.6
/100
|
#202
Poor
12.8%
Hmong
15.0
/100
|
#203
Poor
12.8%
Immigrants | Western Asia
14.1
/100
|
#204
Poor
12.9%
Tsimshian
9.2
/100
|
#205
Tragic
13.0%
Immigrants | Eastern Africa
7.0
/100
|
#206
Tragic
13.1%
Panamanians
6.6
/100
|
#207
Tragic
13.1%
Ugandans
6.2
/100
|
#208
Tragic
13.1%

Demographics Similar to Ethiopians by Poverty

In terms of poverty, the demographic groups most similar to Ethiopians are Immigrants from Fiji (12.2%, a difference of 0.010%), Immigrants from Ethiopia (12.2%, a difference of 0.050%), Colombian (12.2%, a difference of 0.12%), Immigrants from Nepal (12.2%, a difference of 0.13%), and Immigrants from Albania (12.2%, a difference of 0.13%).
DemographicsRating | RankPoverty
Hungarians
63.6
/100
|
#155
Good
12.2%
Scotch-Irish
62.6
/100
|
#156
Good
12.2%
Costa Ricans
62.2
/100
|
#157
Good
12.2%
Taiwanese
61.8
/100
|
#158
Good
12.2%
Pennsylvania Germans
60.8
/100
|
#159
Good
12.2%
Immigrants | Nepal
60.4
/100
|
#160
Good
12.2%
Immigrants | Fiji
59.1
/100
|
#161
Average
12.2%
Ethiopians
59.1
/100
|
#162
Average
12.2%
Immigrants | Ethiopia
58.6
/100
|
#163
Average
12.2%
Colombians
57.8
/100
|
#164
Average
12.2%
Immigrants | Albania
57.7
/100
|
#165
Average
12.2%
Venezuelans
56.9
/100
|
#166
Average
12.2%
Immigrants | Chile
56.7
/100
|
#167
Average
12.2%
Immigrants | Venezuela
56.5
/100
|
#168
Average
12.2%
Whites/Caucasians
55.4
/100
|
#169
Average
12.3%