Immigrants from Serbia vs Hawaiian Receiving Food Stamps
COMPARE
Immigrants from Serbia
Hawaiian
Receiving Food Stamps
Receiving Food Stamps Comparison
Immigrants from Serbia
Hawaiians
9.9%
RECEIVING FOOD STAMPS
99.0/ 100
METRIC RATING
70th/ 347
METRIC RANK
12.9%
RECEIVING FOOD STAMPS
5.4/ 100
METRIC RATING
218th/ 347
METRIC RANK
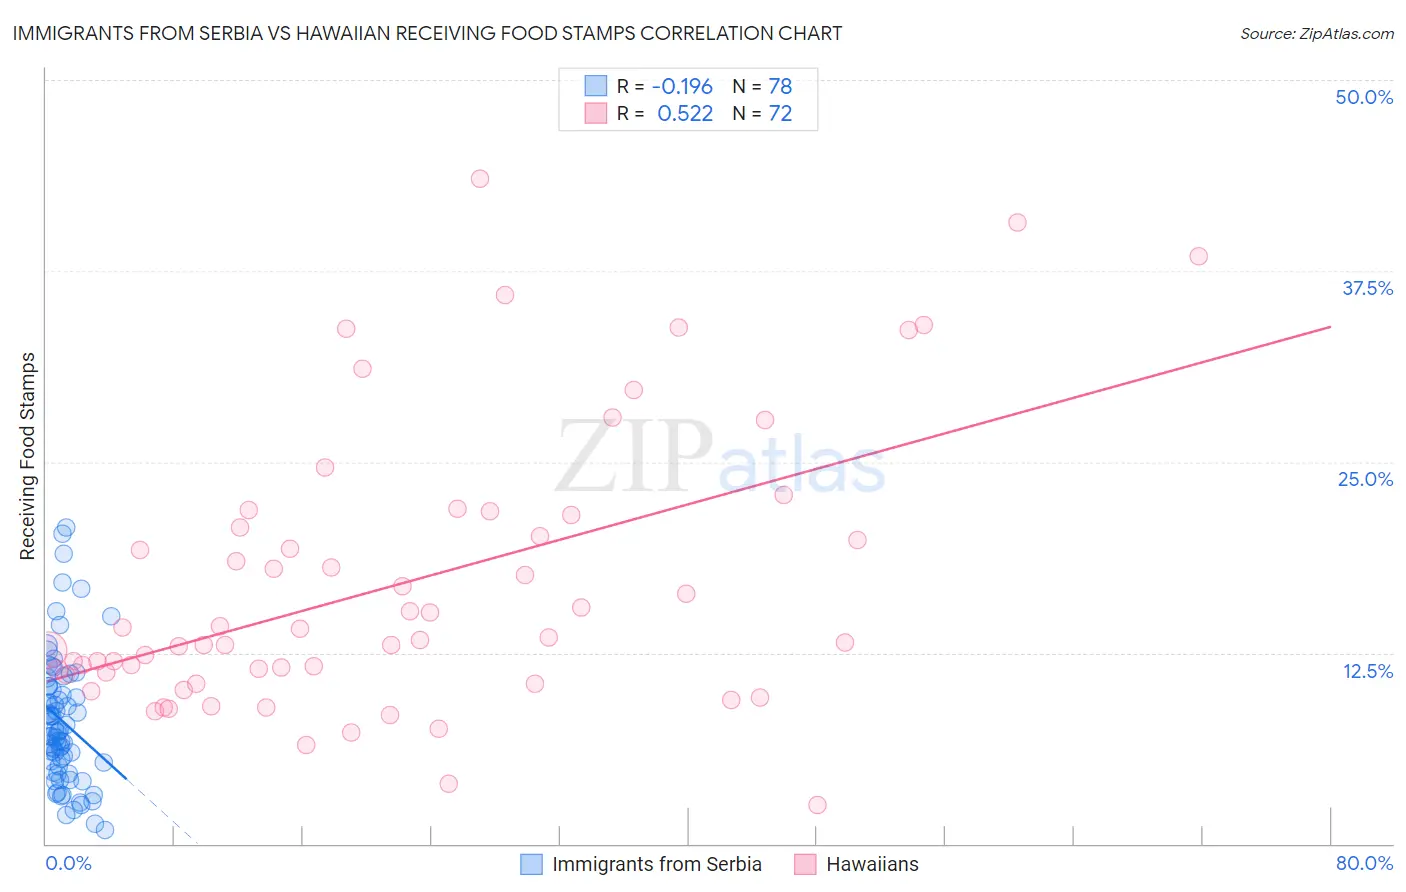
Immigrants from Serbia vs Hawaiian Receiving Food Stamps Correlation Chart
The statistical analysis conducted on geographies consisting of 131,628,490 people shows a poor negative correlation between the proportion of Immigrants from Serbia and percentage of population receiving government assistance and/or food stamps in the United States with a correlation coefficient (R) of -0.196 and weighted average of 9.9%. Similarly, the statistical analysis conducted on geographies consisting of 327,058,596 people shows a substantial positive correlation between the proportion of Hawaiians and percentage of population receiving government assistance and/or food stamps in the United States with a correlation coefficient (R) of 0.522 and weighted average of 12.9%, a difference of 31.0%.
Receiving Food Stamps Correlation Summary
| Measurement | Immigrants from Serbia | Hawaiian |
| Minimum | 0.90% | 2.5% |
| Maximum | 20.7% | 43.5% |
| Range | 19.8% | 41.0% |
| Mean | 8.0% | 17.0% |
| Median | 7.3% | 13.4% |
| Interquartile 25% (IQ1) | 5.1% | 11.1% |
| Interquartile 75% (IQ3) | 10.3% | 21.1% |
| Interquartile Range (IQR) | 5.2% | 10.0% |
| Standard Deviation (Sample) | 4.3% | 9.1% |
| Standard Deviation (Population) | 4.3% | 9.1% |
Similar Demographics by Receiving Food Stamps
Demographics Similar to Immigrants from Serbia by Receiving Food Stamps
In terms of receiving food stamps, the demographic groups most similar to Immigrants from Serbia are Italian (9.9%, a difference of 0.050%), Scottish (9.9%, a difference of 0.13%), Northern European (9.8%, a difference of 0.26%), Immigrants from Indonesia (9.8%, a difference of 0.32%), and Immigrants from Asia (9.9%, a difference of 0.37%).
| Demographics | Rating | Rank | Receiving Food Stamps |
| Chinese | 99.2 /100 | #63 | Exceptional 9.8% |
| Immigrants | North America | 99.2 /100 | #64 | Exceptional 9.8% |
| Immigrants | Turkey | 99.1 /100 | #65 | Exceptional 9.8% |
| Slovenes | 99.1 /100 | #66 | Exceptional 9.8% |
| Immigrants | Indonesia | 99.0 /100 | #67 | Exceptional 9.8% |
| Northern Europeans | 99.0 /100 | #68 | Exceptional 9.8% |
| Italians | 99.0 /100 | #69 | Exceptional 9.9% |
| Immigrants | Serbia | 99.0 /100 | #70 | Exceptional 9.9% |
| Scottish | 98.9 /100 | #71 | Exceptional 9.9% |
| Immigrants | Asia | 98.9 /100 | #72 | Exceptional 9.9% |
| Macedonians | 98.9 /100 | #73 | Exceptional 9.9% |
| New Zealanders | 98.8 /100 | #74 | Exceptional 9.9% |
| Immigrants | Zimbabwe | 98.7 /100 | #75 | Exceptional 9.9% |
| Immigrants | Croatia | 98.7 /100 | #76 | Exceptional 10.0% |
| Immigrants | North Macedonia | 98.7 /100 | #77 | Exceptional 10.0% |
Demographics Similar to Hawaiians by Receiving Food Stamps
In terms of receiving food stamps, the demographic groups most similar to Hawaiians are Immigrants from Middle Africa (12.9%, a difference of 0.010%), Immigrants from Colombia (12.9%, a difference of 0.050%), Immigrants from Burma/Myanmar (12.9%, a difference of 0.37%), Bermudan (13.0%, a difference of 0.37%), and Immigrants from South America (12.8%, a difference of 0.63%).
| Demographics | Rating | Rank | Receiving Food Stamps |
| Colombians | 10.2 /100 | #211 | Poor 12.6% |
| Malaysians | 8.5 /100 | #212 | Tragic 12.7% |
| Moroccans | 7.6 /100 | #213 | Tragic 12.8% |
| Immigrants | Africa | 7.6 /100 | #214 | Tragic 12.8% |
| Native Hawaiians | 6.7 /100 | #215 | Tragic 12.8% |
| Immigrants | South America | 6.5 /100 | #216 | Tragic 12.8% |
| Immigrants | Burma/Myanmar | 6.0 /100 | #217 | Tragic 12.9% |
| Hawaiians | 5.4 /100 | #218 | Tragic 12.9% |
| Immigrants | Middle Africa | 5.4 /100 | #219 | Tragic 12.9% |
| Immigrants | Colombia | 5.3 /100 | #220 | Tragic 12.9% |
| Bermudans | 4.8 /100 | #221 | Tragic 13.0% |
| Immigrants | Immigrants | 4.4 /100 | #222 | Tragic 13.0% |
| Immigrants | Albania | 4.4 /100 | #223 | Tragic 13.0% |
| Immigrants | Armenia | 4.3 /100 | #224 | Tragic 13.0% |
| Fijians | 4.3 /100 | #225 | Tragic 13.0% |