Immigrants from Saudi Arabia vs Immigrants from Trinidad and Tobago Single Mother Poverty
COMPARE
Immigrants from Saudi Arabia
Immigrants from Trinidad and Tobago
Single Mother Poverty
Single Mother Poverty Comparison
Immigrants from Saudi Arabia
Immigrants from Trinidad and Tobago
29.2%
SINGLE MOTHER POVERTY
50.0/ 100
METRIC RATING
174th/ 347
METRIC RANK
29.5%
SINGLE MOTHER POVERTY
29.2/ 100
METRIC RATING
191st/ 347
METRIC RANK
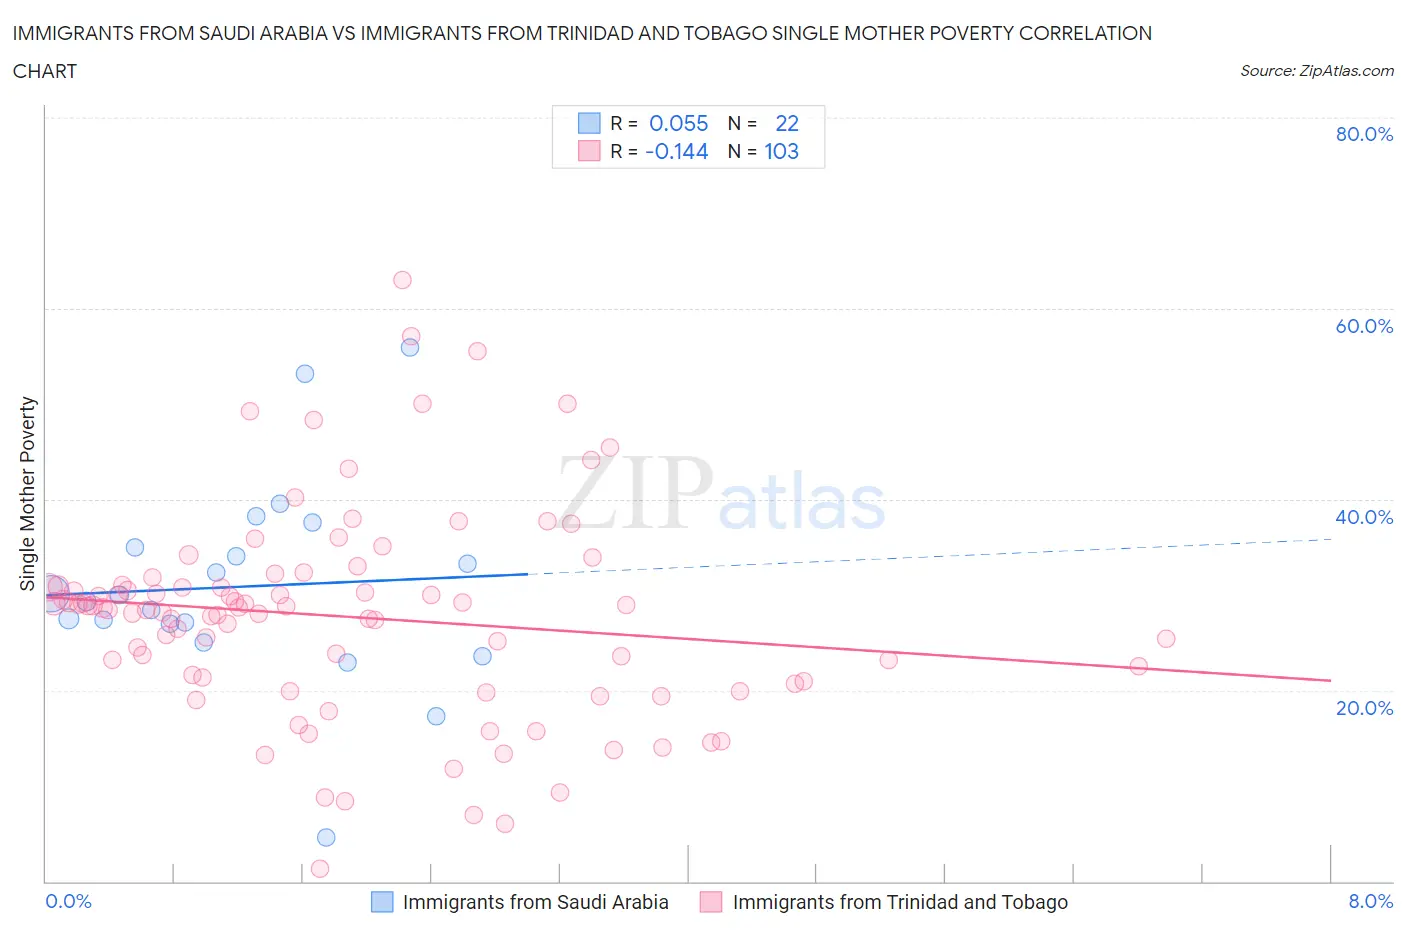
Immigrants from Saudi Arabia vs Immigrants from Trinidad and Tobago Single Mother Poverty Correlation Chart
The statistical analysis conducted on geographies consisting of 162,874,367 people shows a slight positive correlation between the proportion of Immigrants from Saudi Arabia and poverty level among single mothers in the United States with a correlation coefficient (R) of 0.055 and weighted average of 29.2%. Similarly, the statistical analysis conducted on geographies consisting of 220,062,629 people shows a poor negative correlation between the proportion of Immigrants from Trinidad and Tobago and poverty level among single mothers in the United States with a correlation coefficient (R) of -0.144 and weighted average of 29.5%, a difference of 1.1%.
Single Mother Poverty Correlation Summary
| Measurement | Immigrants from Saudi Arabia | Immigrants from Trinidad and Tobago |
| Minimum | 4.6% | 1.3% |
| Maximum | 56.0% | 63.0% |
| Range | 51.3% | 61.7% |
| Mean | 30.9% | 27.7% |
| Median | 29.6% | 28.6% |
| Interquartile 25% (IQ1) | 27.0% | 21.0% |
| Interquartile 75% (IQ3) | 35.0% | 30.9% |
| Interquartile Range (IQR) | 8.0% | 9.9% |
| Standard Deviation (Sample) | 10.7% | 10.9% |
| Standard Deviation (Population) | 10.5% | 10.8% |
Demographics Similar to Immigrants from Saudi Arabia and Immigrants from Trinidad and Tobago by Single Mother Poverty
In terms of single mother poverty, the demographic groups most similar to Immigrants from Saudi Arabia are British (29.2%, a difference of 0.030%), Immigrants from Costa Rica (29.2%, a difference of 0.060%), Hawaiian (29.2%, a difference of 0.10%), Carpatho Rusyn (29.1%, a difference of 0.18%), and Immigrants from Bosnia and Herzegovina (29.2%, a difference of 0.23%). Similarly, the demographic groups most similar to Immigrants from Trinidad and Tobago are Moroccan (29.5%, a difference of 0.030%), Immigrants from Germany (29.5%, a difference of 0.070%), Immigrants from Africa (29.4%, a difference of 0.13%), Guamanian/Chamorro (29.4%, a difference of 0.14%), and Lebanese (29.4%, a difference of 0.18%).
| Demographics | Rating | Rank | Single Mother Poverty |
| Carpatho Rusyns | 53.8 /100 | #172 | Average 29.1% |
| British | 50.6 /100 | #173 | Average 29.2% |
| Immigrants | Saudi Arabia | 50.0 /100 | #174 | Average 29.2% |
| Immigrants | Costa Rica | 48.8 /100 | #175 | Average 29.2% |
| Hawaiians | 47.8 /100 | #176 | Average 29.2% |
| Immigrants | Bosnia and Herzegovina | 45.1 /100 | #177 | Average 29.2% |
| South American Indians | 43.2 /100 | #178 | Average 29.3% |
| Immigrants | Uzbekistan | 42.6 /100 | #179 | Average 29.3% |
| Immigrants | Norway | 41.5 /100 | #180 | Average 29.3% |
| Canadians | 40.4 /100 | #181 | Average 29.3% |
| Immigrants | Eastern Africa | 38.5 /100 | #182 | Fair 29.3% |
| Nepalese | 38.3 /100 | #183 | Fair 29.3% |
| Nigerians | 38.0 /100 | #184 | Fair 29.3% |
| Ghanaians | 36.8 /100 | #185 | Fair 29.4% |
| Yugoslavians | 36.0 /100 | #186 | Fair 29.4% |
| Lebanese | 32.5 /100 | #187 | Fair 29.4% |
| Guamanians/Chamorros | 31.8 /100 | #188 | Fair 29.4% |
| Immigrants | Africa | 31.6 /100 | #189 | Fair 29.4% |
| Immigrants | Germany | 30.4 /100 | #190 | Fair 29.5% |
| Immigrants | Trinidad and Tobago | 29.2 /100 | #191 | Fair 29.5% |
| Moroccans | 28.6 /100 | #192 | Fair 29.5% |