Immigrants from North Macedonia vs Puerto Rican Seniors Poverty Over the Age of 75
COMPARE
Immigrants from North Macedonia
Puerto Rican
Seniors Poverty Over the Age of 75
Seniors Poverty Over the Age of 75 Comparison
Immigrants from North Macedonia
Puerto Ricans
11.1%
SENIORS POVERTY OVER THE AGE OF 75
98.6/ 100
METRIC RATING
51st/ 347
METRIC RANK
23.2%
SENIORS POVERTY OVER THE AGE OF 75
0.0/ 100
METRIC RATING
346th/ 347
METRIC RANK
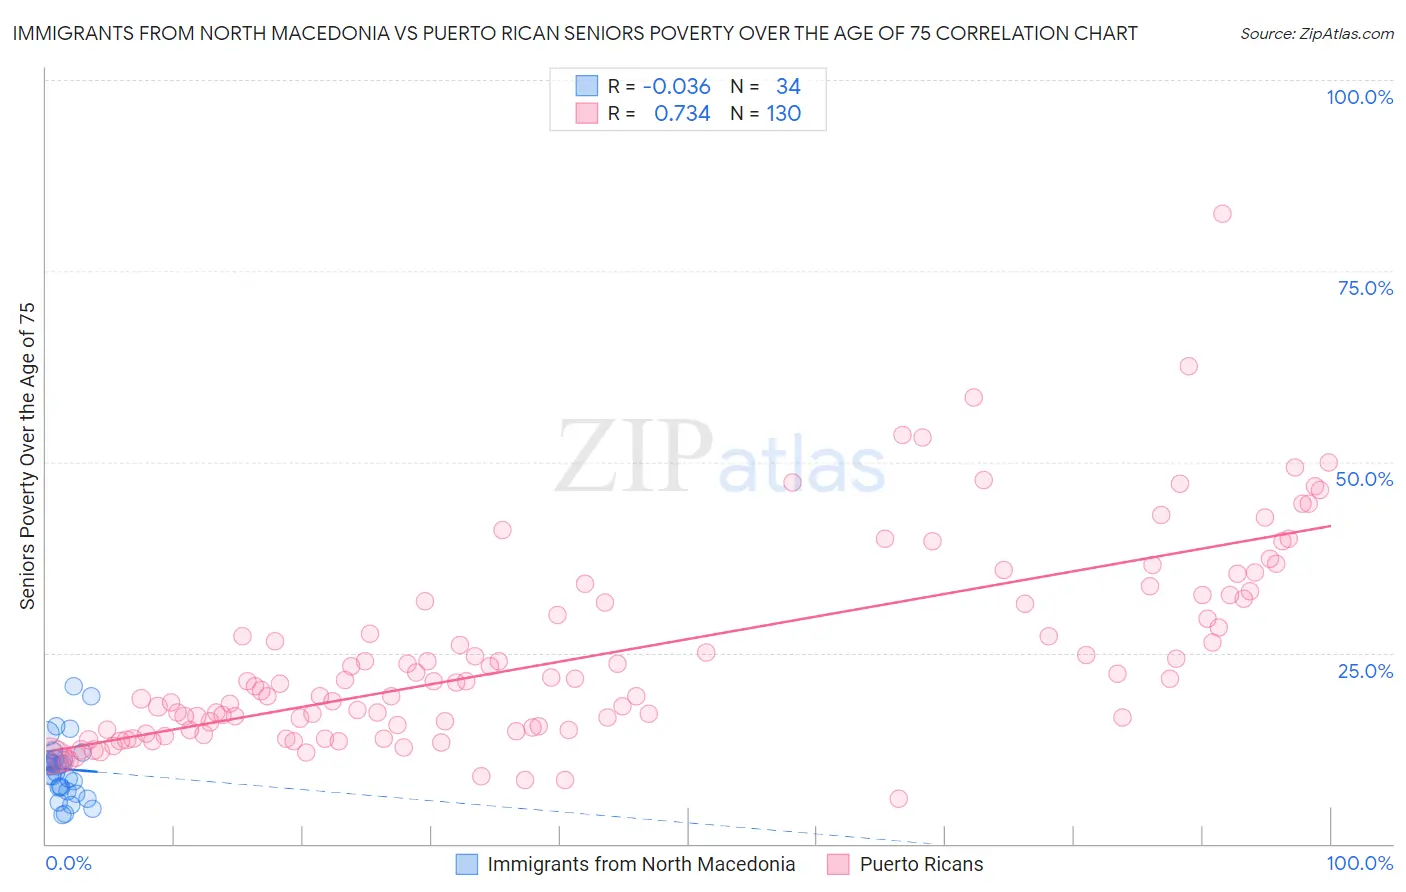
Immigrants from North Macedonia vs Puerto Rican Seniors Poverty Over the Age of 75 Correlation Chart
The statistical analysis conducted on geographies consisting of 74,053,541 people shows no correlation between the proportion of Immigrants from North Macedonia and poverty level among seniors over the age of 75 in the United States with a correlation coefficient (R) of -0.036 and weighted average of 11.1%. Similarly, the statistical analysis conducted on geographies consisting of 517,384,633 people shows a strong positive correlation between the proportion of Puerto Ricans and poverty level among seniors over the age of 75 in the United States with a correlation coefficient (R) of 0.734 and weighted average of 23.2%, a difference of 108.4%.
Seniors Poverty Over the Age of 75 Correlation Summary
| Measurement | Immigrants from North Macedonia | Puerto Rican |
| Minimum | 3.8% | 5.9% |
| Maximum | 20.6% | 82.5% |
| Range | 16.7% | 76.6% |
| Mean | 9.8% | 24.7% |
| Median | 10.1% | 21.2% |
| Interquartile 25% (IQ1) | 7.3% | 14.9% |
| Interquartile 75% (IQ3) | 11.0% | 32.0% |
| Interquartile Range (IQR) | 3.7% | 17.1% |
| Standard Deviation (Sample) | 3.9% | 13.1% |
| Standard Deviation (Population) | 3.8% | 13.0% |
Similar Demographics by Seniors Poverty Over the Age of 75
Demographics Similar to Immigrants from North Macedonia by Seniors Poverty Over the Age of 75
In terms of seniors poverty over the age of 75, the demographic groups most similar to Immigrants from North Macedonia are Serbian (11.1%, a difference of 0.030%), Samoan (11.1%, a difference of 0.14%), Zimbabwean (11.2%, a difference of 0.16%), Immigrants from England (11.2%, a difference of 0.22%), and French (11.1%, a difference of 0.25%).
| Demographics | Rating | Rank | Seniors Poverty Over the Age of 75 |
| Belgians | 99.1 /100 | #44 | Exceptional 11.0% |
| Carpatho Rusyns | 99.0 /100 | #45 | Exceptional 11.1% |
| Greeks | 99.0 /100 | #46 | Exceptional 11.1% |
| Hawaiians | 98.8 /100 | #47 | Exceptional 11.1% |
| French | 98.7 /100 | #48 | Exceptional 11.1% |
| Samoans | 98.7 /100 | #49 | Exceptional 11.1% |
| Serbians | 98.6 /100 | #50 | Exceptional 11.1% |
| Immigrants | North Macedonia | 98.6 /100 | #51 | Exceptional 11.1% |
| Zimbabweans | 98.5 /100 | #52 | Exceptional 11.2% |
| Immigrants | England | 98.4 /100 | #53 | Exceptional 11.2% |
| Afghans | 98.2 /100 | #54 | Exceptional 11.2% |
| Hungarians | 98.1 /100 | #55 | Exceptional 11.2% |
| Slavs | 98.1 /100 | #56 | Exceptional 11.2% |
| Immigrants | Canada | 97.9 /100 | #57 | Exceptional 11.2% |
| Yugoslavians | 97.9 /100 | #58 | Exceptional 11.2% |
Demographics Similar to Puerto Ricans by Seniors Poverty Over the Age of 75
In terms of seniors poverty over the age of 75, the demographic groups most similar to Puerto Ricans are Pima (23.9%, a difference of 2.9%), Immigrants from Dominican Republic (20.1%, a difference of 15.7%), Immigrants from Cuba (19.9%, a difference of 16.6%), Lumbee (19.7%, a difference of 17.5%), and Dominican (19.6%, a difference of 18.3%).
| Demographics | Rating | Rank | Seniors Poverty Over the Age of 75 |
| Immigrants | Nicaragua | 0.0 /100 | #333 | Tragic 17.6% |
| Immigrants | Grenada | 0.0 /100 | #334 | Tragic 17.8% |
| Cubans | 0.0 /100 | #335 | Tragic 18.0% |
| Immigrants | Caribbean | 0.0 /100 | #336 | Tragic 18.2% |
| Yakama | 0.0 /100 | #337 | Tragic 18.3% |
| Immigrants | Cabo Verde | 0.0 /100 | #338 | Tragic 18.5% |
| Hopi | 0.0 /100 | #339 | Tragic 18.9% |
| Tohono O'odham | 0.0 /100 | #340 | Tragic 19.1% |
| Navajo | 0.0 /100 | #341 | Tragic 19.4% |
| Dominicans | 0.0 /100 | #342 | Tragic 19.6% |
| Lumbee | 0.0 /100 | #343 | Tragic 19.7% |
| Immigrants | Cuba | 0.0 /100 | #344 | Tragic 19.9% |
| Immigrants | Dominican Republic | 0.0 /100 | #345 | Tragic 20.1% |
| Puerto Ricans | 0.0 /100 | #346 | Tragic 23.2% |
| Pima | 0.0 /100 | #347 | Tragic 23.9% |