Immigrants from North America vs Cheyenne Seniors Poverty Over the Age of 75

COMPARE

Immigrants from North America
Race
Ancestry
AfghanAfricanAlaska NativeAlaskan AthabascanAlbanianAleutAlsatianAmericanApacheArabArapahoArgentineanArmenianAssyrian/Chaldean/SyriacAustralianAustrianBahamianBangladeshiBarbadianBasqueBelgianBelizeanBermudanBhutaneseBlackfeetBolivianBrazilianBritishBritish West IndianBulgarianBurmeseCajunCambodianCanadianCape VerdeanCarpatho RusynCelticCentral AmericanCentral American IndianCherokeeChickasawChileanChineseChippewaChoctawColombianColvilleComancheCosta RicanCreeCreekCroatianCrowCubanCypriotCzechCzechoslovakianDanishDelawareDominicanDutchDutch West IndianEastern EuropeanEcuadorianEgyptianEnglishEstonianEthiopianEuropeanFijianFilipinoFinnishFrenchFrench American IndianFrench CanadianGermanGerman RussianGhanaianGreekGuamanian/ChamorroGuatemalanGuyaneseHaitianHmongHonduranHopiHoumaHungarianIcelanderIndian (Asian)IndonesianInupiatIranianIraqiIrishIroquoisIsraeliItalianJamaicanJapaneseJordanianKenyanKiowaKoreanLaotianLatvianLebaneseLiberianLithuanianLumbeeLuxembourgerMacedonianMalaysianMalteseMarshalleseMenomineeMexicanMexican American IndianMongolianMoroccanNative HawaiianNavajoNepaleseNew ZealanderNicaraguanNigerianNorthern EuropeanNorwegianOkinawanOsageOttawaPaiutePakistaniPalestinianPanamanianParaguayanPennsylvania GermanPeruvianPimaPolishPortuguesePotawatomiPuebloPuerto RicanPuget Sound SalishRomanianRussianSalvadoranSamoanScandinavianScotch-IrishScottishSeminoleSenegaleseSerbianShoshoneSierra LeoneanSiouxSlavicSlovakSloveneSomaliSouth AfricanSouth AmericanSouth American IndianSoviet UnionSpaniardSpanishSpanish AmericanSpanish American IndianSri LankanSubsaharan AfricanSudaneseSwedishSwissSyrianTaiwaneseThaiTlingit-HaidaTohono O'OdhamTonganTrinidadian and TobagonianTsimshianTurkishU.S. Virgin IslanderUgandanUkrainianUruguayanUteVenezuelanVietnameseWelshWest IndianYakamaYaquiYugoslavianYumanYup'ikZimbabwean
Immigration
NonimmigrantsImmigrantsAfghanistanAfricaAlbaniaArgentinaArmeniaAsiaAustraliaAustriaBahamasBangladeshBarbadosBelarusBelgiumBelizeBoliviaBosnia and HerzegovinaBrazilBulgariaBurma/MyanmarCabo VerdeCambodiaCameroonCanadaCaribbeanCentral AmericaChileChinaColombiaCongoCosta RicaCroatiaCubaCzechoslovakiaDenmarkDominicaDominican RepublicEastern AfricaEastern AsiaEastern EuropeEcuadorEgyptEl SalvadorEnglandEritreaEthiopiaEuropeFijiFranceGermanyGhanaGreeceGrenadaGuatemalaGuyanaHaitiHondurasHong KongHungaryIndiaIndonesiaIranIraqIrelandIsraelItalyJamaicaJapanJordanKazakhstanKenyaKoreaKuwaitLaosLatin AmericaLatviaLebanonLiberiaLithuaniaMalaysiaMexicoMicronesiaMiddle AfricaMoldovaMoroccoNepalNetherlandsNicaraguaNigeriaNorth AmericaNorth MacedoniaNorthern AfricaNorthern EuropeNorwayOceaniaPakistanPanamaPeruPhilippinesPolandPortugalRomaniaRussiaSaudi ArabiaScotlandSenegalSerbiaSierra LeoneSingaporeSomaliaSouth AfricaSouth AmericaSouth Central AsiaSouth Eastern AsiaSouthern EuropeSpainSri LankaSt. Vincent and the GrenadinesSudanSwedenSwitzerlandSyriaTaiwanThailandTrinidad and TobagoTurkeyUgandaUkraineUruguayUzbekistanVenezuelaVietnamWest IndiesWestern AfricaWestern AsiaWestern EuropeYemenZaireZimbabweAzores
Cheyenne
Race
Ancestry
AfghanAfricanAlaska NativeAlaskan AthabascanAlbanianAleutAlsatianAmericanApacheArabArapahoArgentineanArmenianAssyrian/Chaldean/SyriacAustralianAustrianBahamianBangladeshiBarbadianBasqueBelgianBelizeanBermudanBhutaneseBlackfeetBolivianBrazilianBritishBritish West IndianBulgarianBurmeseCajunCambodianCanadianCape VerdeanCarpatho RusynCelticCentral AmericanCentral American IndianCherokeeCheyenneChickasawChileanChineseChippewaChoctawColombianColvilleComancheCosta RicanCreeCreekCroatianCrowCubanCypriotCzechCzechoslovakianDanishDelawareDominicanDutchDutch West IndianEastern EuropeanEcuadorianEgyptianEnglishEstonianEthiopianEuropeanFijianFilipinoFinnishFrenchFrench American IndianFrench CanadianGermanGerman RussianGhanaianGreekGuamanian/ChamorroGuatemalanGuyaneseHaitianHmongHonduranHopiHoumaHungarianIcelanderIndian (Asian)IndonesianInupiatIranianIraqiIrishIroquoisIsraeliItalianJamaicanJapaneseJordanianKenyanKiowaKoreanLaotianLatvianLebaneseLiberianLithuanianLumbeeLuxembourgerMacedonianMalaysianMalteseMarshalleseMenomineeMexicanMexican American IndianMongolianMoroccanNative HawaiianNavajoNepaleseNew ZealanderNicaraguanNigerianNorthern EuropeanNorwegianOkinawanOsageOttawaPaiutePakistaniPalestinianPanamanianParaguayanPennsylvania GermanPeruvianPimaPolishPortuguesePotawatomiPuebloPuerto RicanPuget Sound SalishRomanianRussianSalvadoranSamoanScandinavianScotch-IrishScottishSeminoleSenegaleseSerbianShoshoneSierra LeoneanSiouxSlavicSlovakSloveneSomaliSouth AfricanSouth AmericanSouth American IndianSoviet UnionSpaniardSpanishSpanish AmericanSpanish American IndianSri LankanSubsaharan AfricanSudaneseSwedishSwissSyrianTaiwaneseThaiTlingit-HaidaTohono O'OdhamTonganTrinidadian and TobagonianTsimshianTurkishU.S. Virgin IslanderUgandanUkrainianUruguayanUteVenezuelanVietnameseWelshWest IndianYakamaYaquiYugoslavianYumanYup'ikZimbabwean
Immigration
NonimmigrantsImmigrantsAfghanistanAfricaAlbaniaArgentinaArmeniaAsiaAustraliaAustriaBahamasBangladeshBarbadosBelarusBelgiumBelizeBoliviaBosnia and HerzegovinaBrazilBulgariaBurma/MyanmarCabo VerdeCambodiaCameroonCanadaCaribbeanCentral AmericaChileChinaColombiaCongoCosta RicaCroatiaCubaCzechoslovakiaDenmarkDominicaDominican RepublicEastern AfricaEastern AsiaEastern EuropeEcuadorEgyptEl SalvadorEnglandEritreaEthiopiaEuropeFijiFranceGermanyGhanaGreeceGrenadaGuatemalaGuyanaHaitiHondurasHong KongHungaryIndiaIndonesiaIranIraqIrelandIsraelItalyJamaicaJapanJordanKazakhstanKenyaKoreaKuwaitLaosLatin AmericaLatviaLebanonLiberiaLithuaniaMalaysiaMexicoMicronesiaMiddle AfricaMoldovaMoroccoNepalNetherlandsNicaraguaNigeriaNorth MacedoniaNorthern AfricaNorthern EuropeNorwayOceaniaPakistanPanamaPeruPhilippinesPolandPortugalRomaniaRussiaSaudi ArabiaScotlandSenegalSerbiaSierra LeoneSingaporeSomaliaSouth AfricaSouth AmericaSouth Central AsiaSouth Eastern AsiaSouthern EuropeSpainSri LankaSt. Vincent and the GrenadinesSudanSwedenSwitzerlandSyriaTaiwanThailandTrinidad and TobagoTurkeyUgandaUkraineUruguayUzbekistanVenezuelaVietnamWest IndiesWestern AfricaWestern AsiaWestern EuropeYemenZaireZimbabweAzores
Seniors Poverty Over the Age of 75
Income
Poverty
Unemployment
Labor Participation
Family Structure
Vehicle Availability
Education Level
Disability

Seniors Poverty Over the Age of 75 Comparison

Immigrants from North America

Cheyenne

Exceptional
Tragic
11.3%
SENIORS POVERTY OVER THE AGE OF 75
97.6/ 100
METRIC RATING
62nd/ 347
METRIC RANK
14.9%
SENIORS POVERTY OVER THE AGE OF 75
0.0/ 100
METRIC RATING
284th/ 347
METRIC RANK

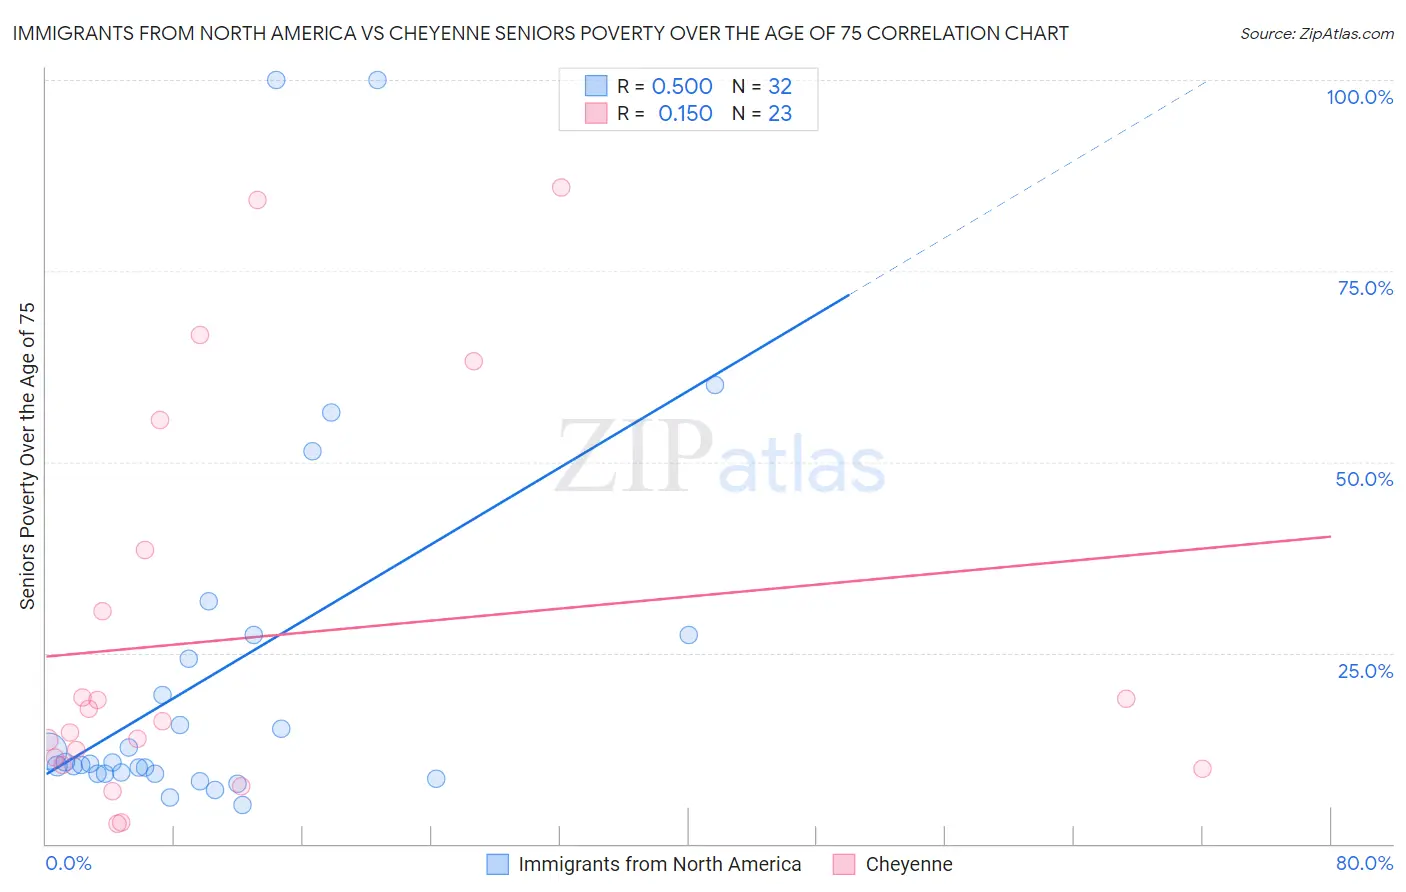
Immigrants from North America vs Cheyenne Seniors Poverty Over the Age of 75 Correlation Chart

The statistical analysis conducted on geographies consisting of 455,027,803 people shows a substantial positive correlation between the proportion of Immigrants from North America and poverty level among seniors over the age of 75 in the United States with a correlation coefficient (R) of 0.500 and weighted average of 11.3%. Similarly, the statistical analysis conducted on geographies consisting of 80,378,238 people shows a poor positive correlation between the proportion of Cheyenne and poverty level among seniors over the age of 75 in the United States with a correlation coefficient (R) of 0.150 and weighted average of 14.9%, a difference of 32.0%.
Immigrants from North America vs Cheyenne Seniors Poverty Over the Age of 75

Seniors Poverty Over the Age of 75 Correlation Summary

MeasurementImmigrants from North AmericaCheyenne
Minimum5.0%2.7%
Maximum100.0%85.9%
Range95.0%83.2%
Mean22.3%27.0%
Median10.5%16.1%
Interquartile 25% (IQ1)9.2%10.3%
Interquartile 75% (IQ3)25.8%38.5%
Interquartile Range (IQR)16.6%28.2%
Standard Deviation (Sample)24.9%25.7%
Standard Deviation (Population)24.5%25.1%

Similar Demographics by Seniors Poverty Over the Age of 75

Demographics Similar to Immigrants from North America by Seniors Poverty Over the Age of 75

In terms of seniors poverty over the age of 75, the demographic groups most similar to Immigrants from North America are Immigrants from Afghanistan (11.3%, a difference of 0.040%), Canadian (11.3%, a difference of 0.10%), Eastern European (11.3%, a difference of 0.13%), Immigrants from Northern Europe (11.3%, a difference of 0.18%), and Immigrants from Netherlands (11.2%, a difference of 0.25%).
DemographicsRating | RankSeniors Poverty Over the Age of 75
Hungarians
98.1
/100
|
#55
Exceptional
11.2%
Slavs
98.1
/100
|
#56
Exceptional
11.2%
Immigrants | Canada
97.9
/100
|
#57
Exceptional
11.2%
Yugoslavians
97.9
/100
|
#58
Exceptional
11.2%
Immigrants | Netherlands
97.8
/100
|
#59
Exceptional
11.2%
Eastern Europeans
97.7
/100
|
#60
Exceptional
11.3%
Canadians
97.7
/100
|
#61
Exceptional
11.3%
Immigrants | North America
97.6
/100
|
#62
Exceptional
11.3%
Immigrants | Afghanistan
97.5
/100
|
#63
Exceptional
11.3%
Immigrants | Northern Europe
97.4
/100
|
#64
Exceptional
11.3%
Immigrants | Taiwan
96.7
/100
|
#65
Exceptional
11.4%
Estonians
96.7
/100
|
#66
Exceptional
11.4%
Bolivians
96.5
/100
|
#67
Exceptional
11.4%
Immigrants | Austria
96.5
/100
|
#68
Exceptional
11.4%
Ottawa
96.5
/100
|
#69
Exceptional
11.4%

Demographics Similar to Cheyenne by Seniors Poverty Over the Age of 75

In terms of seniors poverty over the age of 75, the demographic groups most similar to Cheyenne are Immigrants from Mexico (14.9%, a difference of 0.19%), Immigrants from Central America (15.0%, a difference of 0.53%), Guatemalan (14.8%, a difference of 0.64%), Immigrants from Senegal (14.8%, a difference of 0.70%), and Belizean (14.8%, a difference of 0.88%).
DemographicsRating | RankSeniors Poverty Over the Age of 75
Senegalese
0.0
/100
|
#277
Tragic
14.5%
Immigrants | Colombia
0.0
/100
|
#278
Tragic
14.6%
Blacks/African Americans
0.0
/100
|
#279
Tragic
14.6%
Central Americans
0.0
/100
|
#280
Tragic
14.7%
Belizeans
0.0
/100
|
#281
Tragic
14.8%
Immigrants | Senegal
0.0
/100
|
#282
Tragic
14.8%
Guatemalans
0.0
/100
|
#283
Tragic
14.8%
Cheyenne
0.0
/100
|
#284
Tragic
14.9%
Immigrants | Mexico
0.0
/100
|
#285
Tragic
14.9%
Immigrants | Central America
0.0
/100
|
#286
Tragic
15.0%
Immigrants | Guatemala
0.0
/100
|
#287
Tragic
15.1%
Jamaicans
0.0
/100
|
#288
Tragic
15.1%
Immigrants | Belize
0.0
/100
|
#289
Tragic
15.2%
Immigrants | Azores
0.0
/100
|
#290
Tragic
15.2%
Paiute
0.0
/100
|
#291
Tragic
15.2%