Immigrants from Netherlands vs Alaskan Athabascan Female Poverty

COMPARE

Immigrants from Netherlands
Race
Ancestry
AfghanAfricanAlaska NativeAlbanianAleutAlsatianAmericanApacheArabArapahoArgentineanArmenianAssyrian/Chaldean/SyriacAustralianAustrianBahamianBangladeshiBarbadianBasqueBelgianBelizeanBermudanBhutaneseBlackfeetBolivianBrazilianBritishBritish West IndianBulgarianBurmeseCajunCambodianCanadianCape VerdeanCarpatho RusynCelticCentral AmericanCentral American IndianCherokeeCheyenneChickasawChileanChineseChippewaChoctawColombianColvilleComancheCosta RicanCreeCreekCroatianCrowCubanCypriotCzechCzechoslovakianDanishDelawareDominicanDutchDutch West IndianEastern EuropeanEcuadorianEgyptianEnglishEstonianEthiopianEuropeanFijianFilipinoFinnishFrenchFrench American IndianFrench CanadianGermanGerman RussianGhanaianGreekGuamanian/ChamorroGuatemalanGuyaneseHaitianHmongHonduranHopiHoumaHungarianIcelanderIndian (Asian)IndonesianInupiatIranianIraqiIrishIroquoisIsraeliItalianJamaicanJapaneseJordanianKenyanKiowaKoreanLaotianLatvianLebaneseLiberianLithuanianLumbeeLuxembourgerMacedonianMalaysianMalteseMarshalleseMenomineeMexicanMexican American IndianMongolianMoroccanNative HawaiianNavajoNepaleseNew ZealanderNicaraguanNigerianNorthern EuropeanNorwegianOkinawanOsageOttawaPaiutePakistaniPalestinianPanamanianParaguayanPennsylvania GermanPeruvianPimaPolishPortuguesePotawatomiPuebloPuerto RicanPuget Sound SalishRomanianRussianSalvadoranSamoanScandinavianScotch-IrishScottishSeminoleSenegaleseSerbianShoshoneSierra LeoneanSiouxSlavicSlovakSloveneSomaliSouth AfricanSouth AmericanSouth American IndianSoviet UnionSpaniardSpanishSpanish AmericanSpanish American IndianSri LankanSubsaharan AfricanSudaneseSwedishSwissSyrianTaiwaneseThaiTlingit-HaidaTohono O'OdhamTonganTrinidadian and TobagonianTsimshianTurkishU.S. Virgin IslanderUgandanUkrainianUruguayanUteVenezuelanVietnameseWelshWest IndianYakamaYaquiYugoslavianYumanYup'ikZimbabwean
Immigration
NonimmigrantsImmigrantsAfghanistanAfricaAlbaniaArgentinaArmeniaAsiaAustraliaAustriaBahamasBangladeshBarbadosBelarusBelgiumBelizeBoliviaBosnia and HerzegovinaBrazilBulgariaBurma/MyanmarCabo VerdeCambodiaCameroonCanadaCaribbeanCentral AmericaChileChinaColombiaCongoCosta RicaCroatiaCubaCzechoslovakiaDenmarkDominicaDominican RepublicEastern AfricaEastern AsiaEastern EuropeEcuadorEgyptEl SalvadorEnglandEritreaEthiopiaEuropeFijiFranceGermanyGhanaGreeceGrenadaGuatemalaGuyanaHaitiHondurasHong KongHungaryIndiaIndonesiaIranIraqIrelandIsraelItalyJamaicaJapanJordanKazakhstanKenyaKoreaKuwaitLaosLatin AmericaLatviaLebanonLiberiaLithuaniaMalaysiaMexicoMicronesiaMiddle AfricaMoldovaMoroccoNepalNetherlandsNicaraguaNigeriaNorth AmericaNorth MacedoniaNorthern AfricaNorthern EuropeNorwayOceaniaPakistanPanamaPeruPhilippinesPolandPortugalRomaniaRussiaSaudi ArabiaScotlandSenegalSerbiaSierra LeoneSingaporeSomaliaSouth AfricaSouth AmericaSouth Central AsiaSouth Eastern AsiaSouthern EuropeSpainSri LankaSt. Vincent and the GrenadinesSudanSwedenSwitzerlandSyriaTaiwanThailandTrinidad and TobagoTurkeyUgandaUkraineUruguayUzbekistanVenezuelaVietnamWest IndiesWestern AfricaWestern AsiaWestern EuropeYemenZaireZimbabweAzores
Alaskan Athabascan
Race
Ancestry
AfghanAfricanAlaska NativeAlaskan AthabascanAlbanianAleutAlsatianAmericanApacheArabArapahoArgentineanArmenianAssyrian/Chaldean/SyriacAustralianAustrianBahamianBangladeshiBarbadianBasqueBelgianBelizeanBermudanBhutaneseBlackfeetBolivianBrazilianBritishBritish West IndianBulgarianBurmeseCajunCambodianCanadianCape VerdeanCarpatho RusynCelticCentral AmericanCentral American IndianCherokeeCheyenneChickasawChileanChineseChippewaChoctawColombianColvilleComancheCosta RicanCreeCreekCroatianCrowCubanCypriotCzechCzechoslovakianDanishDelawareDominicanDutchDutch West IndianEastern EuropeanEcuadorianEgyptianEnglishEstonianEthiopianEuropeanFijianFilipinoFinnishFrenchFrench American IndianFrench CanadianGermanGerman RussianGhanaianGreekGuamanian/ChamorroGuatemalanGuyaneseHaitianHmongHonduranHopiHoumaHungarianIcelanderIndian (Asian)IndonesianInupiatIranianIraqiIrishIroquoisIsraeliItalianJamaicanJapaneseJordanianKenyanKiowaKoreanLaotianLatvianLebaneseLiberianLithuanianLumbeeLuxembourgerMacedonianMalaysianMalteseMarshalleseMenomineeMexicanMexican American IndianMongolianMoroccanNative HawaiianNavajoNepaleseNew ZealanderNicaraguanNigerianNorthern EuropeanNorwegianOkinawanOsageOttawaPaiutePakistaniPalestinianPanamanianParaguayanPennsylvania GermanPeruvianPimaPolishPortuguesePotawatomiPuebloPuerto RicanPuget Sound SalishRomanianRussianSalvadoranSamoanScandinavianScotch-IrishScottishSeminoleSenegaleseSerbianShoshoneSierra LeoneanSiouxSlavicSlovakSloveneSomaliSouth AfricanSouth AmericanSouth American IndianSoviet UnionSpaniardSpanishSpanish AmericanSpanish American IndianSri LankanSubsaharan AfricanSudaneseSwedishSwissSyrianTaiwaneseThaiTlingit-HaidaTohono O'OdhamTonganTrinidadian and TobagonianTsimshianTurkishU.S. Virgin IslanderUgandanUkrainianUruguayanUteVenezuelanVietnameseWelshWest IndianYakamaYaquiYugoslavianYumanYup'ikZimbabwean
Immigration
NonimmigrantsImmigrantsAfghanistanAfricaAlbaniaArgentinaArmeniaAsiaAustraliaAustriaBahamasBangladeshBarbadosBelarusBelgiumBelizeBoliviaBosnia and HerzegovinaBrazilBulgariaBurma/MyanmarCabo VerdeCambodiaCameroonCanadaCaribbeanCentral AmericaChileChinaColombiaCongoCosta RicaCroatiaCubaCzechoslovakiaDenmarkDominicaDominican RepublicEastern AfricaEastern AsiaEastern EuropeEcuadorEgyptEl SalvadorEnglandEritreaEthiopiaEuropeFijiFranceGermanyGhanaGreeceGrenadaGuatemalaGuyanaHaitiHondurasHong KongHungaryIndiaIndonesiaIranIraqIrelandIsraelItalyJamaicaJapanJordanKazakhstanKenyaKoreaKuwaitLaosLatin AmericaLatviaLebanonLiberiaLithuaniaMalaysiaMexicoMicronesiaMiddle AfricaMoldovaMoroccoNepalNicaraguaNigeriaNorth AmericaNorth MacedoniaNorthern AfricaNorthern EuropeNorwayOceaniaPakistanPanamaPeruPhilippinesPolandPortugalRomaniaRussiaSaudi ArabiaScotlandSenegalSerbiaSierra LeoneSingaporeSomaliaSouth AfricaSouth AmericaSouth Central AsiaSouth Eastern AsiaSouthern EuropeSpainSri LankaSt. Vincent and the GrenadinesSudanSwedenSwitzerlandSyriaTaiwanThailandTrinidad and TobagoTurkeyUgandaUkraineUruguayUzbekistanVenezuelaVietnamWest IndiesWestern AfricaWestern AsiaWestern EuropeYemenZaireZimbabweAzores
Female Poverty
Income
Poverty
Unemployment
Labor Participation
Family Structure
Vehicle Availability
Education Level
Disability

Female Poverty Comparison

Immigrants from Netherlands

Alaskan Athabascans

Exceptional
Tragic
12.2%
FEMALE POVERTY
97.8/ 100
METRIC RATING
68th/ 347
METRIC RANK
14.4%
FEMALE POVERTY
5.3/ 100
METRIC RATING
213th/ 347
METRIC RANK

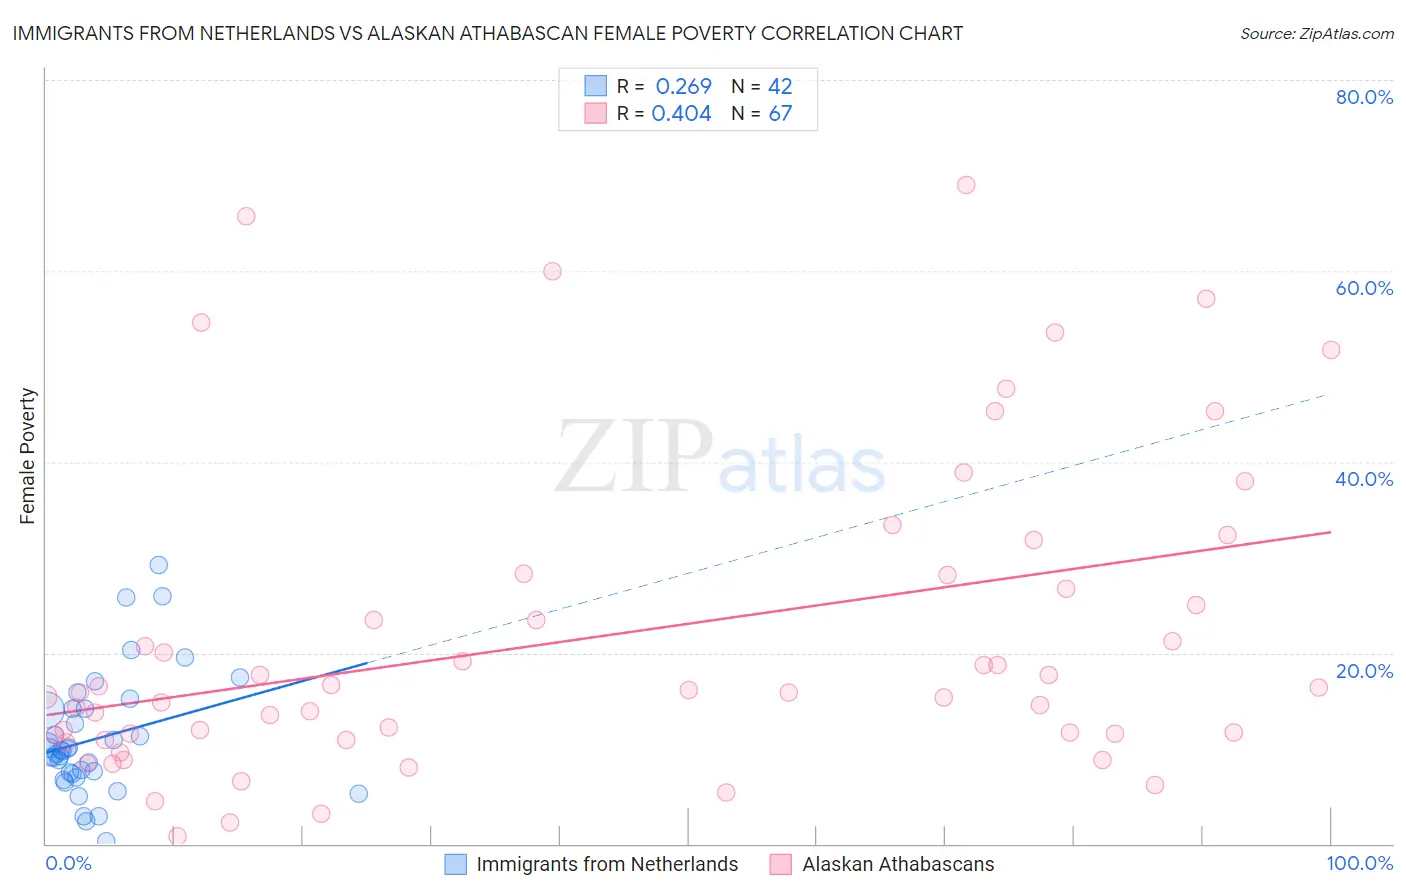
Immigrants from Netherlands vs Alaskan Athabascan Female Poverty Correlation Chart

The statistical analysis conducted on geographies consisting of 237,788,507 people shows a weak positive correlation between the proportion of Immigrants from Netherlands and poverty level among females in the United States with a correlation coefficient (R) of 0.269 and weighted average of 12.2%. Similarly, the statistical analysis conducted on geographies consisting of 45,807,044 people shows a moderate positive correlation between the proportion of Alaskan Athabascans and poverty level among females in the United States with a correlation coefficient (R) of 0.404 and weighted average of 14.4%, a difference of 17.7%.
Immigrants from Netherlands vs Alaskan Athabascan Female Poverty

Female Poverty Correlation Summary

MeasurementImmigrants from NetherlandsAlaskan Athabascan
Minimum0.30%0.78%
Maximum29.1%69.0%
Range28.8%68.2%
Mean11.0%21.7%
Median9.7%15.9%
Interquartile 25% (IQ1)7.4%11.4%
Interquartile 75% (IQ3)14.1%28.2%
Interquartile Range (IQR)6.7%16.9%
Standard Deviation (Sample)6.3%16.4%
Standard Deviation (Population)6.2%16.3%

Similar Demographics by Female Poverty

Demographics Similar to Immigrants from Netherlands by Female Poverty

In terms of female poverty, the demographic groups most similar to Immigrants from Netherlands are Immigrants from Eastern Asia (12.2%, a difference of 0.040%), Swiss (12.2%, a difference of 0.10%), Immigrants from Belgium (12.2%, a difference of 0.13%), Austrian (12.2%, a difference of 0.17%), and Indian (Asian) (12.2%, a difference of 0.18%).
DemographicsRating | RankFemale Poverty
Immigrants | Asia
98.1
/100
|
#61
Exceptional
12.2%
Immigrants | Italy
98.0
/100
|
#62
Exceptional
12.2%
Ukrainians
98.0
/100
|
#63
Exceptional
12.2%
Germans
98.0
/100
|
#64
Exceptional
12.2%
Indians (Asian)
97.9
/100
|
#65
Exceptional
12.2%
Austrians
97.9
/100
|
#66
Exceptional
12.2%
Immigrants | Eastern Asia
97.8
/100
|
#67
Exceptional
12.2%
Immigrants | Netherlands
97.8
/100
|
#68
Exceptional
12.2%
Swiss
97.7
/100
|
#69
Exceptional
12.2%
Immigrants | Belgium
97.7
/100
|
#70
Exceptional
12.2%
Carpatho Rusyns
97.6
/100
|
#71
Exceptional
12.2%
Cambodians
97.5
/100
|
#72
Exceptional
12.2%
Zimbabweans
97.5
/100
|
#73
Exceptional
12.3%
Immigrants | Canada
97.5
/100
|
#74
Exceptional
12.3%
Europeans
97.4
/100
|
#75
Exceptional
12.3%

Demographics Similar to Alaskan Athabascans by Female Poverty

In terms of female poverty, the demographic groups most similar to Alaskan Athabascans are Bermudan (14.4%, a difference of 0.080%), Marshallese (14.4%, a difference of 0.16%), Immigrants from Panama (14.4%, a difference of 0.30%), Immigrants from Thailand (14.4%, a difference of 0.39%), and Immigrants (14.4%, a difference of 0.42%).
DemographicsRating | RankFemale Poverty
Immigrants | Uruguay
14.0
/100
|
#206
Poor
14.0%
Immigrants | Eastern Africa
9.0
/100
|
#207
Tragic
14.2%
Immigrants | Azores
7.9
/100
|
#208
Tragic
14.2%
Panamanians
7.7
/100
|
#209
Tragic
14.2%
Malaysians
7.4
/100
|
#210
Tragic
14.3%
Moroccans
7.2
/100
|
#211
Tragic
14.3%
Bermudans
5.5
/100
|
#212
Tragic
14.4%
Alaskan Athabascans
5.3
/100
|
#213
Tragic
14.4%
Marshallese
5.0
/100
|
#214
Tragic
14.4%
Immigrants | Panama
4.7
/100
|
#215
Tragic
14.4%
Immigrants | Thailand
4.5
/100
|
#216
Tragic
14.4%
Immigrants | Immigrants
4.5
/100
|
#217
Tragic
14.4%
Immigrants | Uzbekistan
4.4
/100
|
#218
Tragic
14.4%
Japanese
4.1
/100
|
#219
Tragic
14.5%
Alsatians
4.0
/100
|
#220
Tragic
14.5%