Immigrants from Micronesia vs Immigrants from Japan Female Poverty Among 18-24 Year Olds

COMPARE

Immigrants from Micronesia
Race
Ancestry
AfghanAfricanAlaska NativeAlaskan AthabascanAlbanianAleutAlsatianAmericanApacheArabArapahoArgentineanArmenianAssyrian/Chaldean/SyriacAustralianAustrianBahamianBangladeshiBarbadianBasqueBelgianBelizeanBermudanBhutaneseBlackfeetBolivianBrazilianBritishBritish West IndianBulgarianBurmeseCajunCambodianCanadianCape VerdeanCarpatho RusynCelticCentral AmericanCentral American IndianCherokeeCheyenneChickasawChileanChineseChippewaChoctawColombianColvilleComancheCosta RicanCreeCreekCroatianCrowCubanCypriotCzechCzechoslovakianDanishDelawareDominicanDutchDutch West IndianEastern EuropeanEcuadorianEgyptianEnglishEstonianEthiopianEuropeanFijianFilipinoFinnishFrenchFrench American IndianFrench CanadianGermanGerman RussianGhanaianGreekGuamanian/ChamorroGuatemalanGuyaneseHaitianHmongHonduranHopiHoumaHungarianIcelanderIndian (Asian)IndonesianInupiatIranianIraqiIrishIroquoisIsraeliItalianJamaicanJapaneseJordanianKenyanKiowaKoreanLaotianLatvianLebaneseLiberianLithuanianLumbeeLuxembourgerMacedonianMalaysianMalteseMarshalleseMenomineeMexicanMexican American IndianMongolianMoroccanNative HawaiianNavajoNepaleseNew ZealanderNicaraguanNigerianNorthern EuropeanNorwegianOkinawanOsageOttawaPaiutePakistaniPalestinianPanamanianParaguayanPennsylvania GermanPeruvianPimaPolishPortuguesePotawatomiPuebloPuerto RicanPuget Sound SalishRomanianRussianSalvadoranSamoanScandinavianScotch-IrishScottishSeminoleSenegaleseSerbianShoshoneSierra LeoneanSiouxSlavicSlovakSloveneSomaliSouth AfricanSouth AmericanSouth American IndianSoviet UnionSpaniardSpanishSpanish AmericanSpanish American IndianSri LankanSubsaharan AfricanSudaneseSwedishSwissSyrianTaiwaneseThaiTlingit-HaidaTohono O'OdhamTonganTrinidadian and TobagonianTsimshianTurkishU.S. Virgin IslanderUgandanUkrainianUruguayanUteVenezuelanVietnameseWelshWest IndianYakamaYaquiYugoslavianYumanYup'ikZimbabwean
Immigration
NonimmigrantsImmigrantsAfghanistanAfricaAlbaniaArgentinaArmeniaAsiaAustraliaAustriaBahamasBangladeshBarbadosBelarusBelgiumBelizeBoliviaBosnia and HerzegovinaBrazilBulgariaBurma/MyanmarCabo VerdeCambodiaCameroonCanadaCaribbeanCentral AmericaChileChinaColombiaCongoCosta RicaCroatiaCubaCzechoslovakiaDenmarkDominicaDominican RepublicEastern AfricaEastern AsiaEastern EuropeEcuadorEgyptEl SalvadorEnglandEritreaEthiopiaEuropeFijiFranceGermanyGhanaGreeceGrenadaGuatemalaGuyanaHaitiHondurasHong KongHungaryIndiaIndonesiaIranIraqIrelandIsraelItalyJamaicaJordanKazakhstanKenyaKoreaKuwaitLaosLatin AmericaLatviaLebanonLiberiaLithuaniaMalaysiaMexicoMicronesiaMiddle AfricaMoldovaMoroccoNepalNetherlandsNicaraguaNigeriaNorth AmericaNorth MacedoniaNorthern AfricaNorthern EuropeNorwayOceaniaPakistanPanamaPeruPhilippinesPolandPortugalRomaniaRussiaSaudi ArabiaScotlandSenegalSerbiaSierra LeoneSingaporeSomaliaSouth AfricaSouth AmericaSouth Central AsiaSouth Eastern AsiaSouthern EuropeSpainSri LankaSt. Vincent and the GrenadinesSudanSwedenSwitzerlandSyriaTaiwanThailandTrinidad and TobagoTurkeyUgandaUkraineUruguayUzbekistanVenezuelaVietnamWest IndiesWestern AfricaWestern AsiaWestern EuropeYemenZaireZimbabweAzores
Immigrants from Japan
Race
Ancestry
AfghanAfricanAlaska NativeAlaskan AthabascanAlbanianAleutAlsatianAmericanApacheArabArapahoArgentineanArmenianAssyrian/Chaldean/SyriacAustralianAustrianBahamianBangladeshiBarbadianBasqueBelgianBelizeanBermudanBhutaneseBlackfeetBolivianBrazilianBritishBritish West IndianBulgarianBurmeseCajunCambodianCanadianCape VerdeanCarpatho RusynCelticCentral AmericanCentral American IndianCherokeeCheyenneChickasawChileanChineseChippewaChoctawColombianColvilleComancheCosta RicanCreeCreekCroatianCrowCubanCypriotCzechCzechoslovakianDanishDelawareDominicanDutchDutch West IndianEastern EuropeanEcuadorianEgyptianEnglishEstonianEthiopianEuropeanFijianFilipinoFinnishFrenchFrench American IndianFrench CanadianGermanGerman RussianGhanaianGreekGuamanian/ChamorroGuatemalanGuyaneseHaitianHmongHonduranHopiHoumaHungarianIcelanderIndian (Asian)IndonesianInupiatIranianIraqiIrishIroquoisIsraeliItalianJamaicanJapaneseJordanianKenyanKiowaKoreanLaotianLatvianLebaneseLiberianLithuanianLumbeeLuxembourgerMacedonianMalaysianMalteseMarshalleseMenomineeMexicanMexican American IndianMongolianMoroccanNative HawaiianNavajoNepaleseNew ZealanderNicaraguanNigerianNorthern EuropeanNorwegianOkinawanOsageOttawaPaiutePakistaniPalestinianPanamanianParaguayanPennsylvania GermanPeruvianPimaPolishPortuguesePotawatomiPuebloPuerto RicanPuget Sound SalishRomanianRussianSalvadoranSamoanScandinavianScotch-IrishScottishSeminoleSenegaleseSerbianShoshoneSierra LeoneanSiouxSlavicSlovakSloveneSomaliSouth AfricanSouth AmericanSouth American IndianSoviet UnionSpaniardSpanishSpanish AmericanSpanish American IndianSri LankanSubsaharan AfricanSudaneseSwedishSwissSyrianTaiwaneseThaiTlingit-HaidaTohono O'OdhamTonganTrinidadian and TobagonianTsimshianTurkishU.S. Virgin IslanderUgandanUkrainianUruguayanUteVenezuelanVietnameseWelshWest IndianYakamaYaquiYugoslavianYumanYup'ikZimbabwean
Immigration
NonimmigrantsImmigrantsAfghanistanAfricaAlbaniaArgentinaArmeniaAsiaAustraliaAustriaBahamasBangladeshBarbadosBelarusBelgiumBelizeBoliviaBosnia and HerzegovinaBrazilBulgariaBurma/MyanmarCabo VerdeCambodiaCameroonCanadaCaribbeanCentral AmericaChileChinaColombiaCongoCosta RicaCroatiaCubaCzechoslovakiaDenmarkDominicaDominican RepublicEastern AfricaEastern AsiaEastern EuropeEcuadorEgyptEl SalvadorEnglandEritreaEthiopiaEuropeFijiFranceGermanyGhanaGreeceGrenadaGuatemalaGuyanaHaitiHondurasHong KongHungaryIndiaIndonesiaIranIraqIrelandIsraelItalyJamaicaJapanJordanKazakhstanKenyaKoreaKuwaitLaosLatin AmericaLatviaLebanonLiberiaLithuaniaMalaysiaMexicoMiddle AfricaMoldovaMoroccoNepalNetherlandsNicaraguaNigeriaNorth AmericaNorth MacedoniaNorthern AfricaNorthern EuropeNorwayOceaniaPakistanPanamaPeruPhilippinesPolandPortugalRomaniaRussiaSaudi ArabiaScotlandSenegalSerbiaSierra LeoneSingaporeSomaliaSouth AfricaSouth AmericaSouth Central AsiaSouth Eastern AsiaSouthern EuropeSpainSri LankaSt. Vincent and the GrenadinesSudanSwedenSwitzerlandSyriaTaiwanThailandTrinidad and TobagoTurkeyUgandaUkraineUruguayUzbekistanVenezuelaVietnamWest IndiesWestern AfricaWestern AsiaWestern EuropeYemenZaireZimbabweAzores
Female Poverty Among 18-24 Year Olds
Income
Poverty
Unemployment
Labor Participation
Family Structure
Vehicle Availability
Education Level
Disability

Female Poverty Among 18-24 Year Olds Comparison

Immigrants from Micronesia

Immigrants from Japan

Tragic
Good
20.7%
FEMALE POVERTY AMONG 18-24 YEAR OLDS
9.6/ 100
METRIC RATING
219th/ 347
METRIC RANK
19.8%
FEMALE POVERTY AMONG 18-24 YEAR OLDS
78.1/ 100
METRIC RATING
153rd/ 347
METRIC RANK

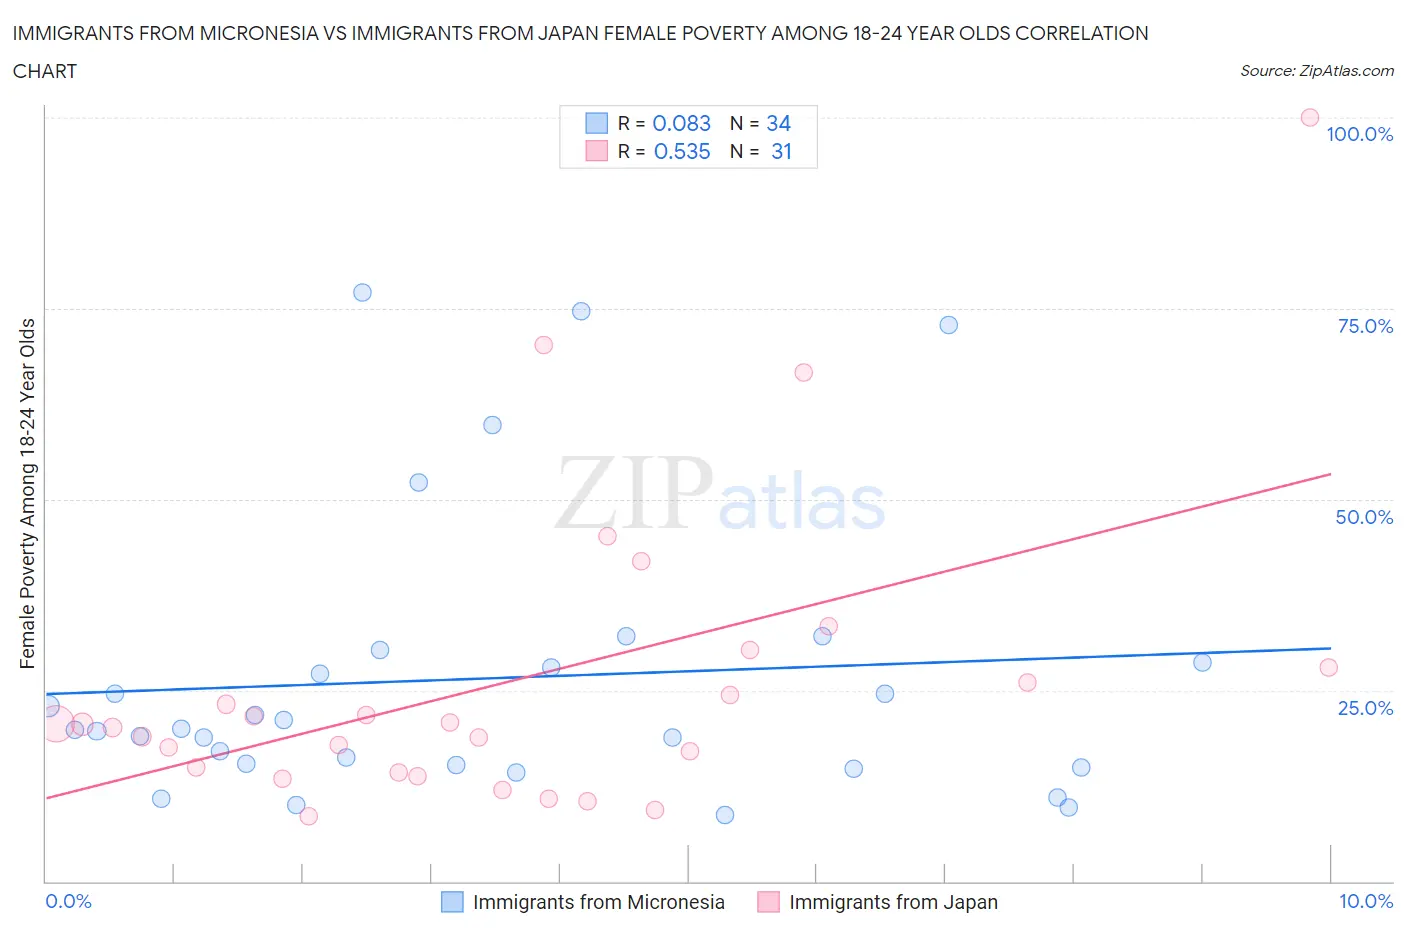
Immigrants from Micronesia vs Immigrants from Japan Female Poverty Among 18-24 Year Olds Correlation Chart

The statistical analysis conducted on geographies consisting of 61,440,220 people shows a slight positive correlation between the proportion of Immigrants from Micronesia and poverty level among females between the ages 18 and 24 in the United States with a correlation coefficient (R) of 0.083 and weighted average of 20.7%. Similarly, the statistical analysis conducted on geographies consisting of 334,056,060 people shows a substantial positive correlation between the proportion of Immigrants from Japan and poverty level among females between the ages 18 and 24 in the United States with a correlation coefficient (R) of 0.535 and weighted average of 19.8%, a difference of 4.4%.
Immigrants from Micronesia vs Immigrants from Japan Female Poverty Among 18-24 Year Olds

Female Poverty Among 18-24 Year Olds Correlation Summary

MeasurementImmigrants from MicronesiaImmigrants from Japan
Minimum8.7%8.5%
Maximum77.1%100.0%
Range68.4%91.5%
Mean26.6%26.2%
Median19.9%20.6%
Interquartile 25% (IQ1)15.2%14.3%
Interquartile 75% (IQ3)28.6%28.0%
Interquartile Range (IQR)13.4%13.7%
Standard Deviation (Sample)18.7%20.1%
Standard Deviation (Population)18.4%19.7%

Similar Demographics by Female Poverty Among 18-24 Year Olds

Demographics Similar to Immigrants from Micronesia by Female Poverty Among 18-24 Year Olds

In terms of female poverty among 18-24 year olds, the demographic groups most similar to Immigrants from Micronesia are Immigrants from Nepal (20.7%, a difference of 0.010%), Immigrants from Laos (20.6%, a difference of 0.020%), British (20.7%, a difference of 0.020%), Immigrants from Western Africa (20.6%, a difference of 0.090%), and Barbadian (20.7%, a difference of 0.090%).
DemographicsRating | RankFemale Poverty Among 18-24 Year Olds
Liberians
11.6
/100
|
#212
Poor
20.6%
Northern Europeans
11.6
/100
|
#213
Poor
20.6%
Immigrants | South Africa
10.7
/100
|
#214
Poor
20.6%
Spanish
10.4
/100
|
#215
Poor
20.6%
Immigrants | Western Africa
10.2
/100
|
#216
Poor
20.6%
Immigrants | Laos
9.7
/100
|
#217
Tragic
20.6%
Immigrants | Nepal
9.6
/100
|
#218
Tragic
20.7%
Immigrants | Micronesia
9.6
/100
|
#219
Tragic
20.7%
British
9.4
/100
|
#220
Tragic
20.7%
Barbadians
9.0
/100
|
#221
Tragic
20.7%
Guatemalans
8.1
/100
|
#222
Tragic
20.7%
French
7.9
/100
|
#223
Tragic
20.7%
Immigrants | Liberia
7.6
/100
|
#224
Tragic
20.7%
Norwegians
7.3
/100
|
#225
Tragic
20.7%
Estonians
7.2
/100
|
#226
Tragic
20.7%

Demographics Similar to Immigrants from Japan by Female Poverty Among 18-24 Year Olds

In terms of female poverty among 18-24 year olds, the demographic groups most similar to Immigrants from Japan are Yugoslavian (19.8%, a difference of 0.060%), Immigrants from Zimbabwe (19.8%, a difference of 0.10%), Hungarian (19.8%, a difference of 0.11%), Immigrants from Eastern Asia (19.8%, a difference of 0.12%), and Immigrants from Belgium (19.8%, a difference of 0.12%).
DemographicsRating | RankFemale Poverty Among 18-24 Year Olds
Immigrants | Bosnia and Herzegovina
83.6
/100
|
#146
Excellent
19.7%
Immigrants | Austria
83.1
/100
|
#147
Excellent
19.7%
Immigrants | Latin America
81.3
/100
|
#148
Excellent
19.7%
Immigrants | Oceania
81.2
/100
|
#149
Excellent
19.7%
Syrians
80.2
/100
|
#150
Excellent
19.8%
Immigrants | Eastern Asia
79.7
/100
|
#151
Good
19.8%
Yugoslavians
79.0
/100
|
#152
Good
19.8%
Immigrants | Japan
78.1
/100
|
#153
Good
19.8%
Immigrants | Zimbabwe
76.7
/100
|
#154
Good
19.8%
Hungarians
76.6
/100
|
#155
Good
19.8%
Immigrants | Belgium
76.4
/100
|
#156
Good
19.8%
Danes
75.5
/100
|
#157
Good
19.8%
Immigrants | Lebanon
75.3
/100
|
#158
Good
19.8%
Trinidadians and Tobagonians
74.4
/100
|
#159
Good
19.8%
Pakistanis
74.1
/100
|
#160
Good
19.8%