Immigrants from Micronesia vs Ethiopian Female Poverty Among 18-24 Year Olds
COMPARE
Immigrants from Micronesia
Ethiopian
Female Poverty Among 18-24 Year Olds
Female Poverty Among 18-24 Year Olds Comparison
Immigrants from Micronesia
Ethiopians
20.7%
FEMALE POVERTY AMONG 18-24 YEAR OLDS
9.6/ 100
METRIC RATING
219th/ 347
METRIC RANK
20.2%
FEMALE POVERTY AMONG 18-24 YEAR OLDS
43.8/ 100
METRIC RATING
179th/ 347
METRIC RANK
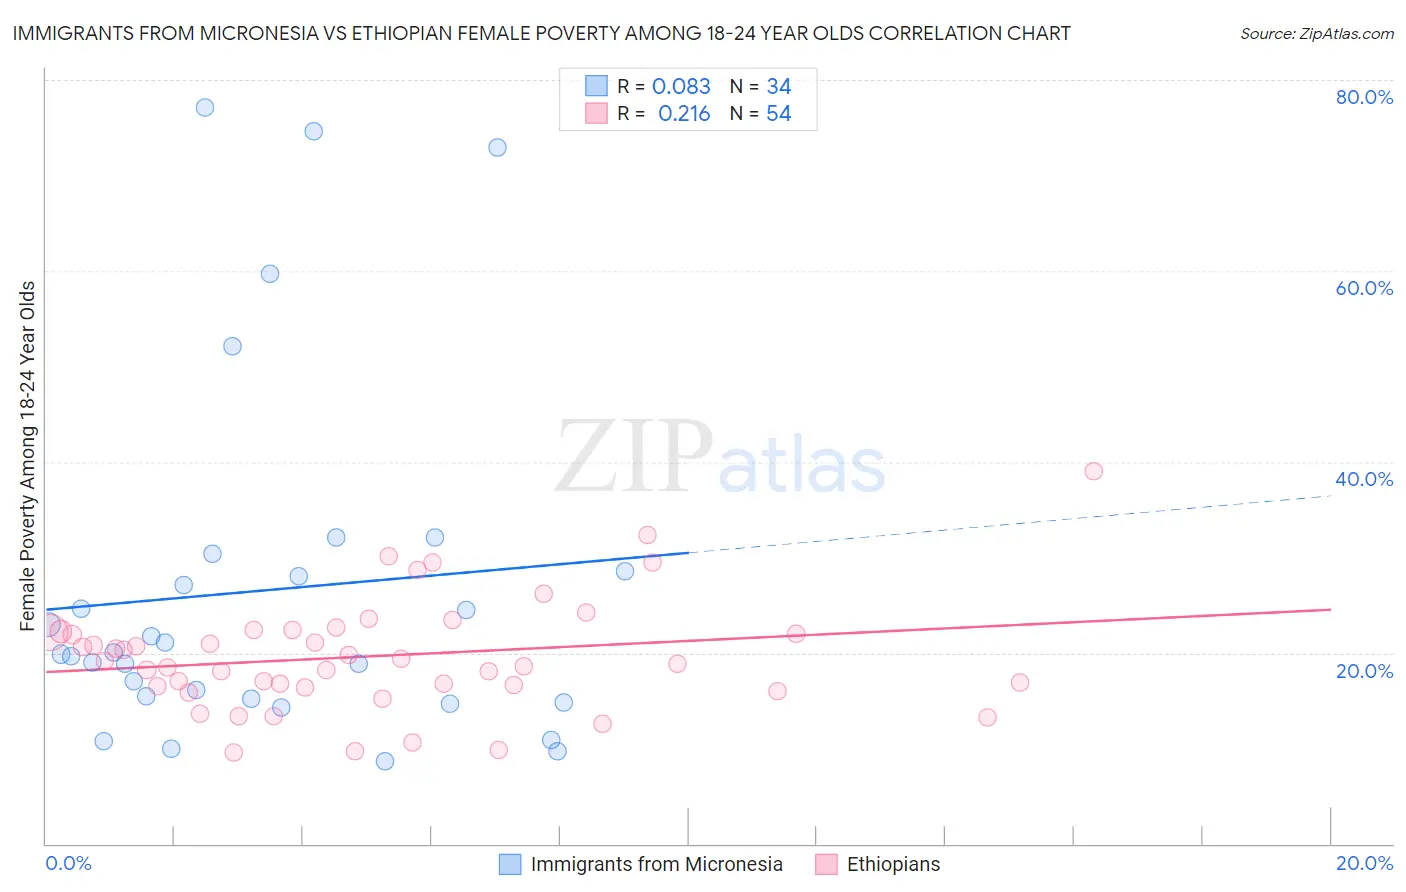
Immigrants from Micronesia vs Ethiopian Female Poverty Among 18-24 Year Olds Correlation Chart
The statistical analysis conducted on geographies consisting of 61,440,220 people shows a slight positive correlation between the proportion of Immigrants from Micronesia and poverty level among females between the ages 18 and 24 in the United States with a correlation coefficient (R) of 0.083 and weighted average of 20.7%. Similarly, the statistical analysis conducted on geographies consisting of 221,304,111 people shows a weak positive correlation between the proportion of Ethiopians and poverty level among females between the ages 18 and 24 in the United States with a correlation coefficient (R) of 0.216 and weighted average of 20.2%, a difference of 2.4%.
Female Poverty Among 18-24 Year Olds Correlation Summary
| Measurement | Immigrants from Micronesia | Ethiopian |
| Minimum | 8.7% | 9.5% |
| Maximum | 77.1% | 39.0% |
| Range | 68.4% | 29.5% |
| Mean | 26.6% | 19.6% |
| Median | 19.9% | 19.0% |
| Interquartile 25% (IQ1) | 15.2% | 16.6% |
| Interquartile 75% (IQ3) | 28.6% | 22.3% |
| Interquartile Range (IQR) | 13.4% | 5.7% |
| Standard Deviation (Sample) | 18.7% | 5.8% |
| Standard Deviation (Population) | 18.4% | 5.7% |
Similar Demographics by Female Poverty Among 18-24 Year Olds
Demographics Similar to Immigrants from Micronesia by Female Poverty Among 18-24 Year Olds
In terms of female poverty among 18-24 year olds, the demographic groups most similar to Immigrants from Micronesia are Immigrants from Nepal (20.7%, a difference of 0.010%), Immigrants from Laos (20.6%, a difference of 0.020%), British (20.7%, a difference of 0.020%), Immigrants from Western Africa (20.6%, a difference of 0.090%), and Barbadian (20.7%, a difference of 0.090%).
| Demographics | Rating | Rank | Female Poverty Among 18-24 Year Olds |
| Liberians | 11.6 /100 | #212 | Poor 20.6% |
| Northern Europeans | 11.6 /100 | #213 | Poor 20.6% |
| Immigrants | South Africa | 10.7 /100 | #214 | Poor 20.6% |
| Spanish | 10.4 /100 | #215 | Poor 20.6% |
| Immigrants | Western Africa | 10.2 /100 | #216 | Poor 20.6% |
| Immigrants | Laos | 9.7 /100 | #217 | Tragic 20.6% |
| Immigrants | Nepal | 9.6 /100 | #218 | Tragic 20.7% |
| Immigrants | Micronesia | 9.6 /100 | #219 | Tragic 20.7% |
| British | 9.4 /100 | #220 | Tragic 20.7% |
| Barbadians | 9.0 /100 | #221 | Tragic 20.7% |
| Guatemalans | 8.1 /100 | #222 | Tragic 20.7% |
| French | 7.9 /100 | #223 | Tragic 20.7% |
| Immigrants | Liberia | 7.6 /100 | #224 | Tragic 20.7% |
| Norwegians | 7.3 /100 | #225 | Tragic 20.7% |
| Estonians | 7.2 /100 | #226 | Tragic 20.7% |
Demographics Similar to Ethiopians by Female Poverty Among 18-24 Year Olds
In terms of female poverty among 18-24 year olds, the demographic groups most similar to Ethiopians are Swiss (20.2%, a difference of 0.010%), Immigrants from Kazakhstan (20.2%, a difference of 0.020%), Iraqi (20.2%, a difference of 0.020%), Immigrants from China (20.2%, a difference of 0.040%), and Immigrants from Barbados (20.2%, a difference of 0.050%).
| Demographics | Rating | Rank | Female Poverty Among 18-24 Year Olds |
| Belizeans | 52.0 /100 | #172 | Average 20.1% |
| Irish | 50.0 /100 | #173 | Average 20.1% |
| Swedes | 50.0 /100 | #174 | Average 20.1% |
| South American Indians | 48.4 /100 | #175 | Average 20.1% |
| Kenyans | 44.9 /100 | #176 | Average 20.2% |
| Immigrants | Kazakhstan | 44.2 /100 | #177 | Average 20.2% |
| Swiss | 44.0 /100 | #178 | Average 20.2% |
| Ethiopians | 43.8 /100 | #179 | Average 20.2% |
| Iraqis | 43.3 /100 | #180 | Average 20.2% |
| Immigrants | China | 43.0 /100 | #181 | Average 20.2% |
| Immigrants | Barbados | 42.8 /100 | #182 | Average 20.2% |
| Lebanese | 40.6 /100 | #183 | Average 20.2% |
| Immigrants | Central America | 39.9 /100 | #184 | Fair 20.2% |
| Nepalese | 39.7 /100 | #185 | Fair 20.2% |
| Immigrants | Ethiopia | 37.3 /100 | #186 | Fair 20.2% |